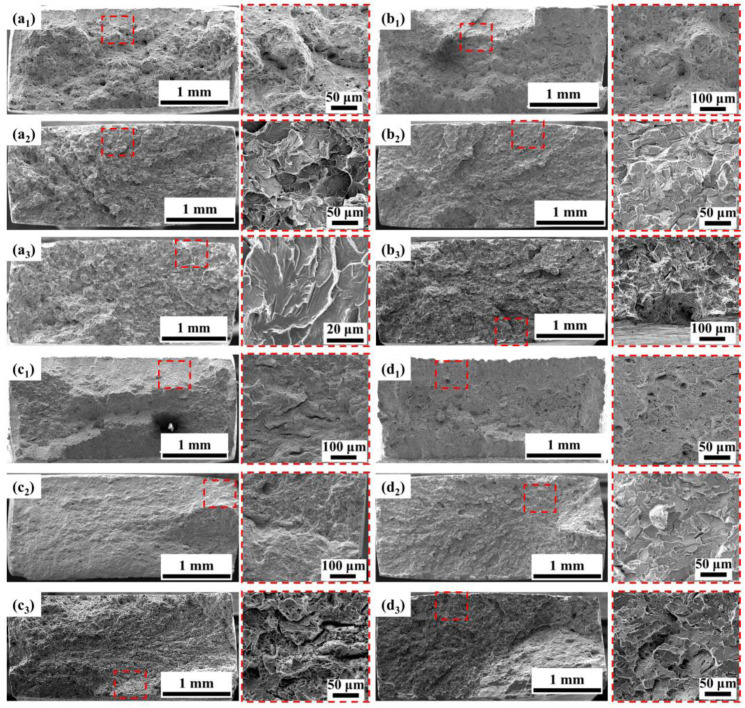
Figure 10.
Fracture morphology of different test steels after SSRT tests in various test conditions: (a1) BM in air; (a2) BM at OCP; (a3) BM at −1200 mV; (b1) 0.5NiCu in air; (b2) 0.5NiCu at OCP; (b3) 0.5NiCu at −1200 mV; (c1) 1NiCu in air; (c2) 1NiCu at OCP; (c3) 1NiCu at −1200 mV; (d1) LNiCu in air; (d2) LNiCu at OCP; (d3) LNiCu at −1200 mV (The red squares show the crack initiation sites and the typical morphology).

