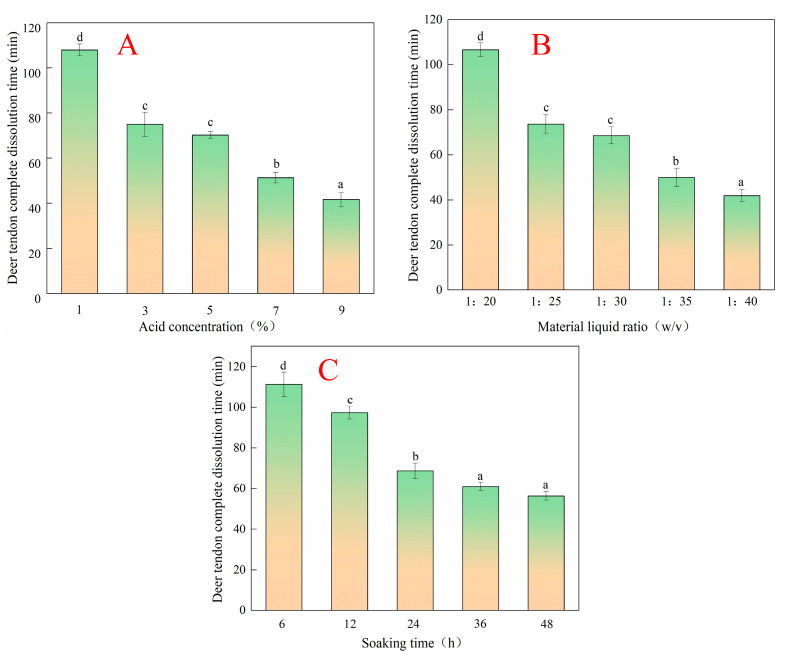
Figure 1.
Effects of acid concentration, material–liquid ratio, and soaking time on the deer tendon complete dissolution time ((A): acid concentration; (B): material–liquid ratio; (C): soaking time). The different lowercase letters mean that the variance of different samples is significant (p < 0.05). Vertical bars indicate mean values ± SD (n = 3).

