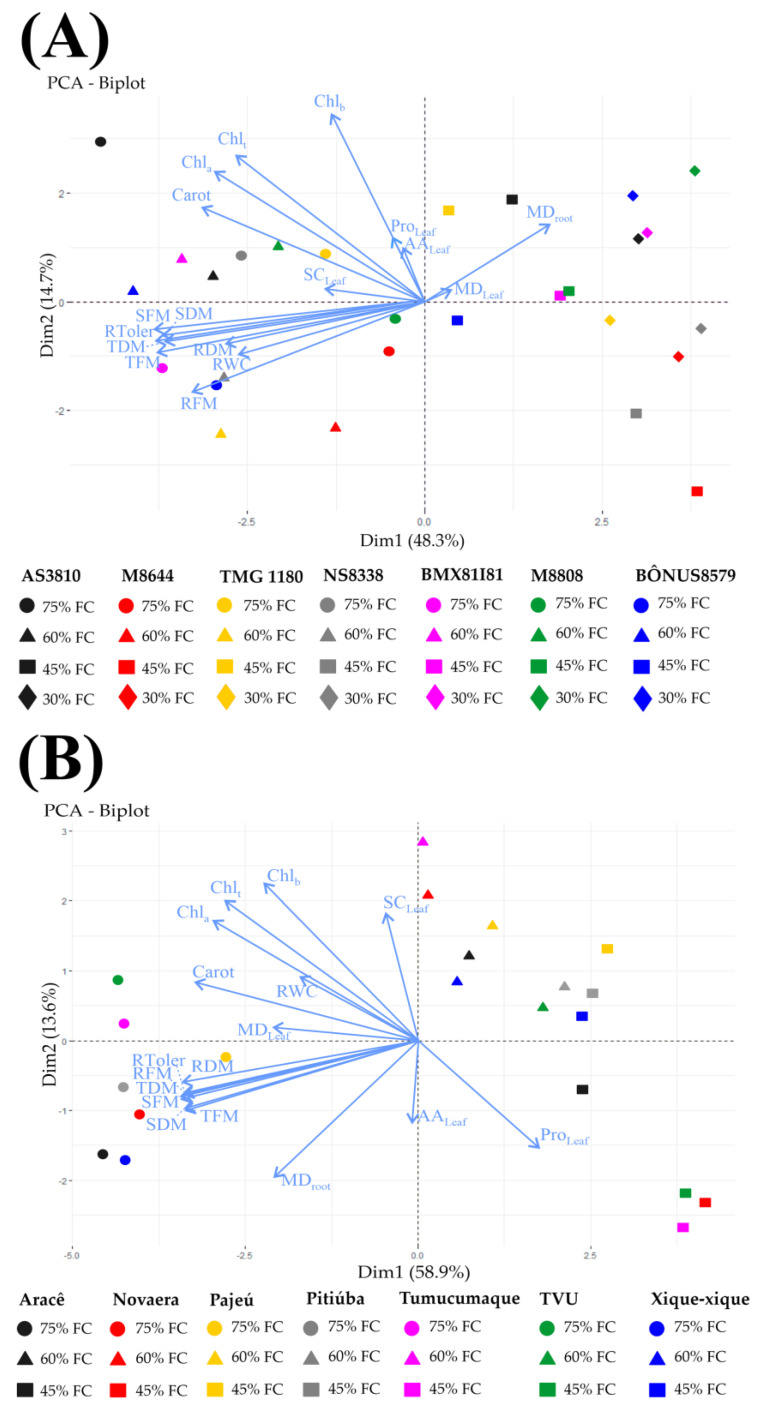
Figure 5.
Principal Component Analysis (PCA). Scatter plots of parameters investigated in soybean (A) and cowpea (B) cultivars under different water availability levels (75, 60, 45, and 30% of field capacity—FC). The X and Y axes indicate the percentage of variance explained by each Principal Component (PC). The loading plot displays the contribution of the following parameters: shoot fresh mass (SFM), root fresh mass (RFM), and total fresh mass (TFM); shoot dry mass (SDM), root dry mass (RDM), and total dry mass (TDM); relative tolerance to drought (RToler); relative water content (RWC); membrane damage in leaves (MDleaf) and roots (MDroot); contents of chlorophyll a (Chla), chlorophyll b (Chlb), total chlorophyll (Chlt), and carotenoids (Carot); contents of soluble carbohydrates (SCleaf), free amino acids (AAleaf), and proline (Proleaf) in the leaves.

