. 2023 Sep 8;131(9):097005. doi: 10.1289/EHP12565

Figure 1.

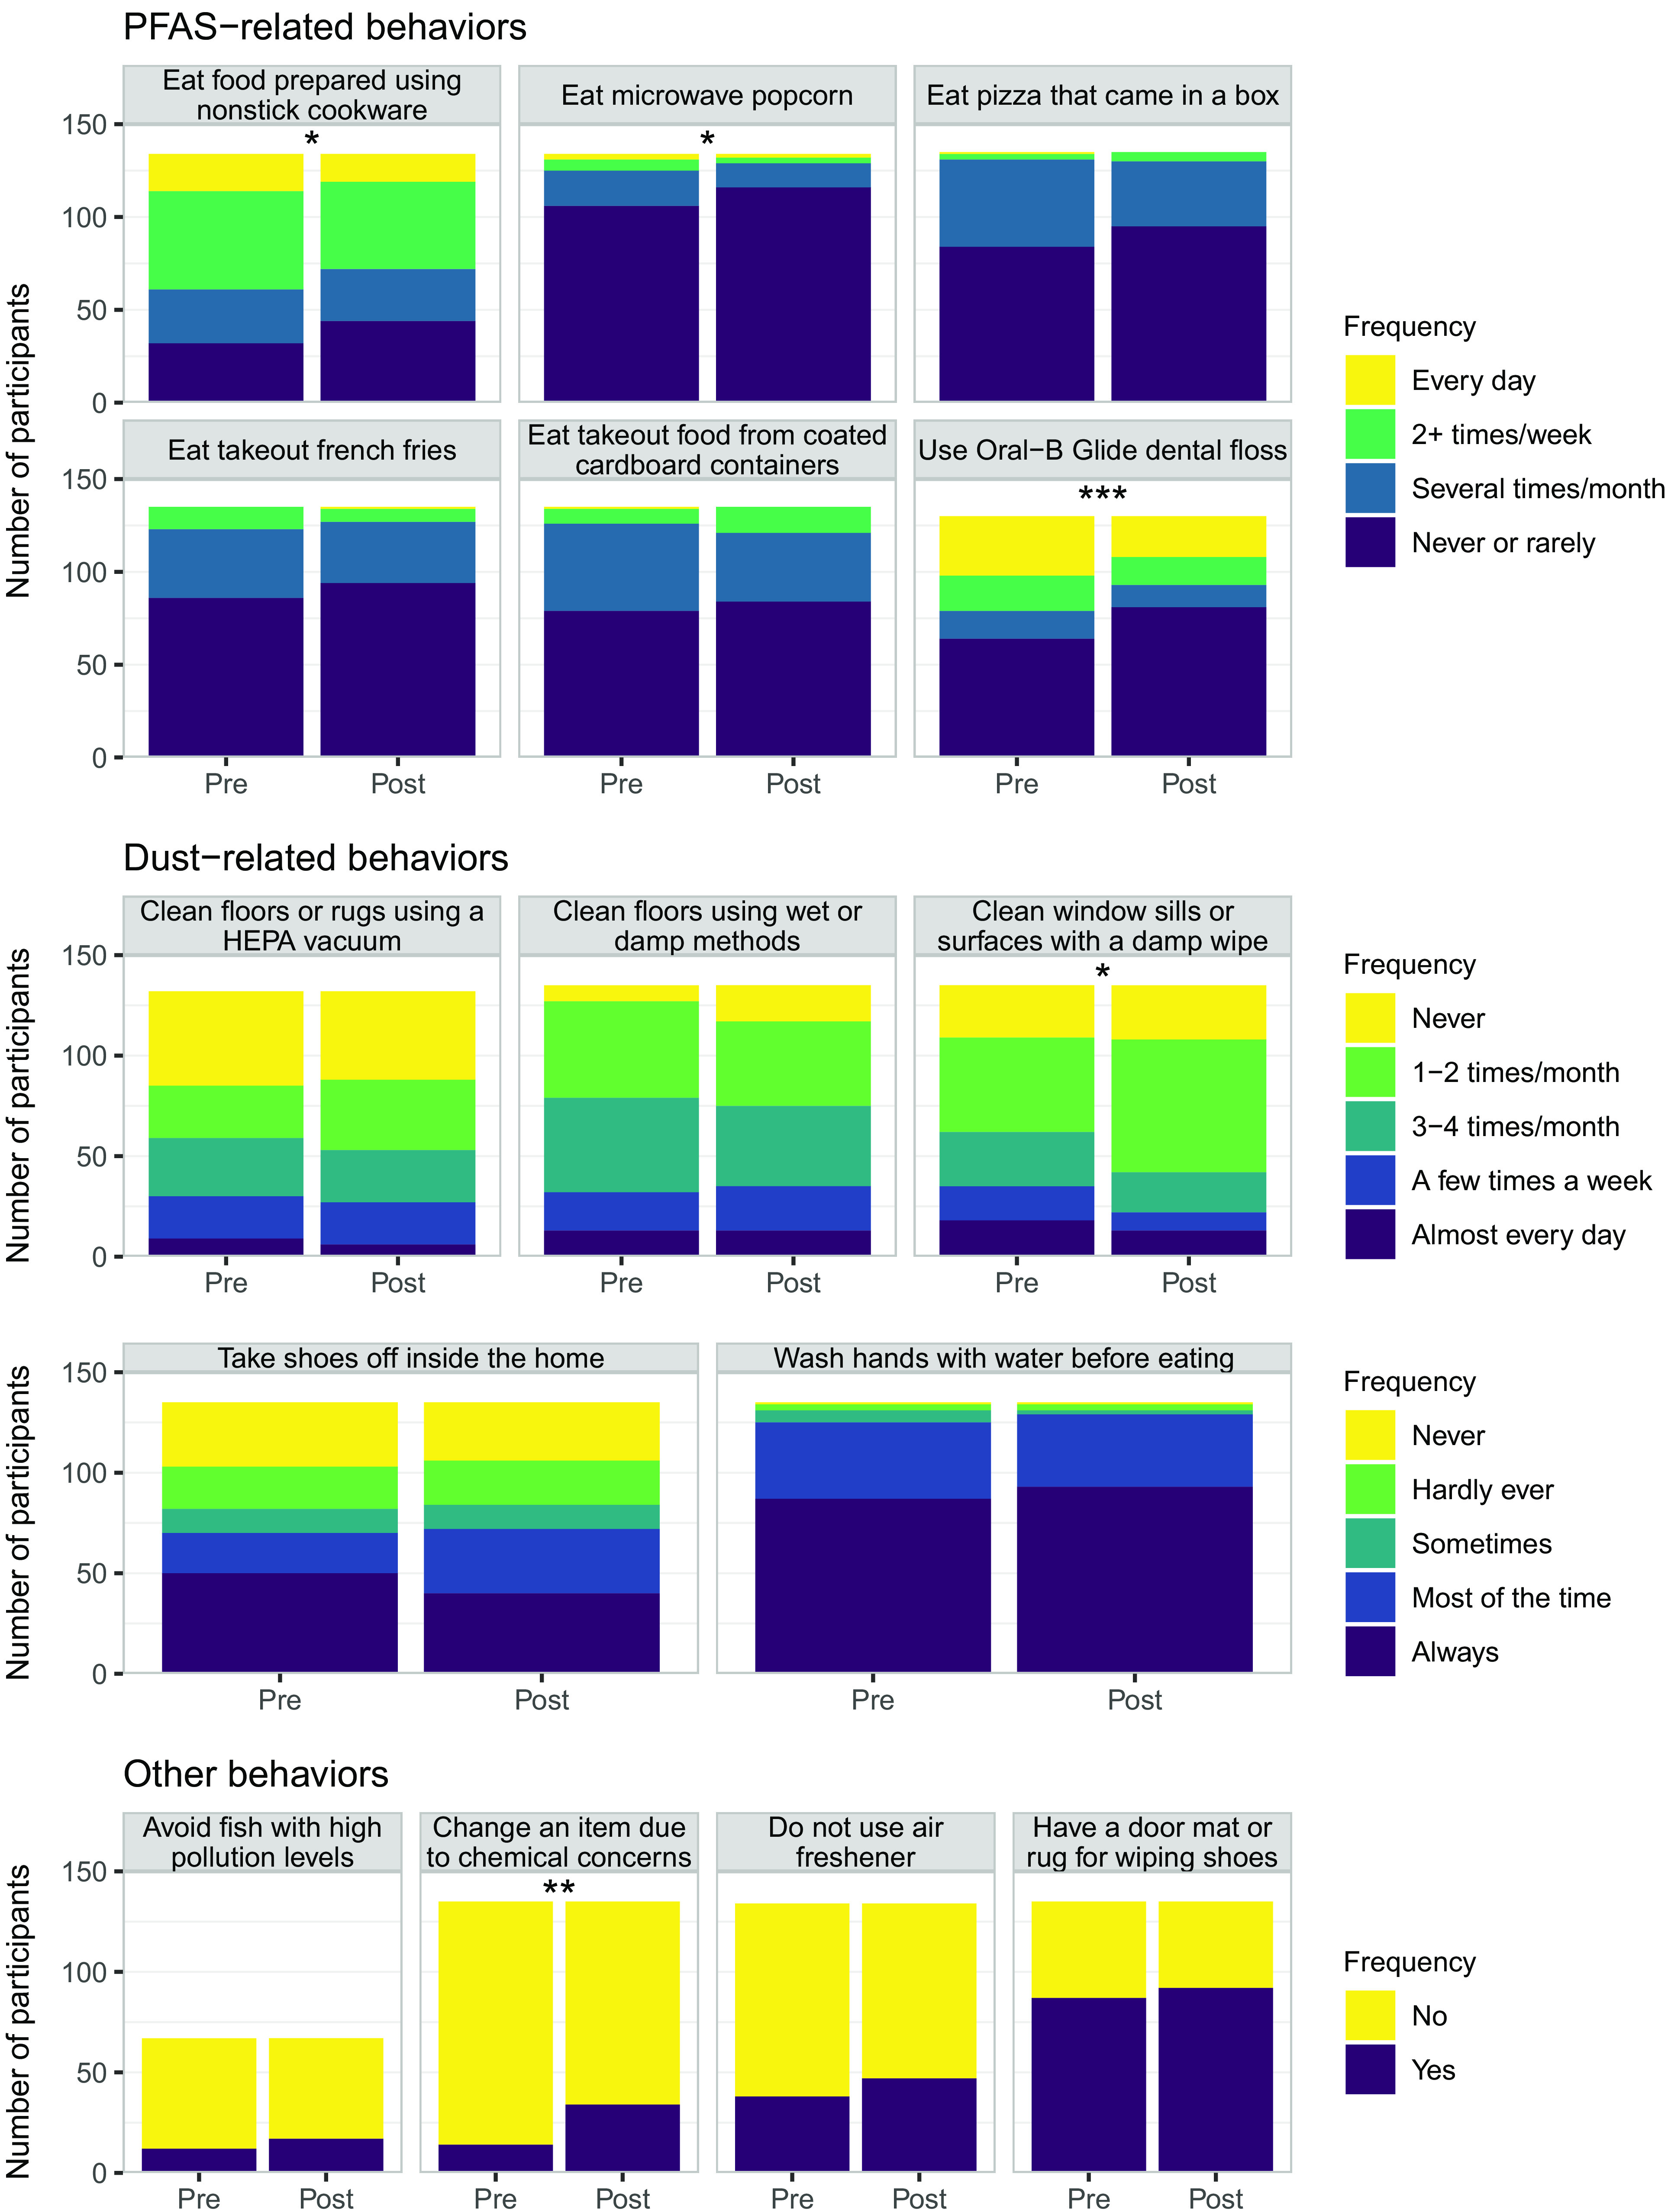
Figure 1 is a set of fifteen stacked bar graphs. In the top section labeled Per- and polyfluoroalkyl substances related behaviors, the six graphs are titled Eat food prepared using nonstick cookware, Eat microwave popcorn, Eat pizza that came in a box, Eat takeout french fries, Eat takeout food from coated cardboard containers, and Use Oral-B Glide dental floss, plotting number of participants, ranging from 0 to 150 in increments of 50 (y-axis) across pre and post (x-axis) for frequency, including every day, 2 plus times per week, several times per month, and never or rarely. In the center section labeled Dust-related behaviors, the five graphs are titled Clean floors or rugs using a HEPA vacuum, Clean floors using wet or damp methods, Clean window sills or surfaces with a damp wipe, Take shoes off inside the home, and Wash hands with water before eating, plotting number of participants, ranging from 0 to 150 in increments of 50 (y-axis) across pre and post (x-axis) for frequency, including never, 1 to 2 times per month, 3 to 4 times per month, a few times a week, and almost every day for the first 3 behaviors; and never, hardly ever, sometimes, most of the time, and always for the last 2 behaviors. In the bottom section labeled Other behaviors, the four graphs are titled Avoid fish with high pollution levels, Change an item due to chemical concerns, Do not use air freshener, and Have a door mat or rug for wiping shoes, plotting number of participants, ranging from 0 to 150 in increments of 50 (y-axis) across pre and post (x-axis) for frequency, including no and yes.

Frequency of performing exposure-related environmental health behaviors, before and after receiving report-back. Frequency of behavior was assessed for the previous month, except for taking shoes off and handwashing, which were assessed for the previous week. A total of 11 out of 135 participants had missing data for one behavior: using Oral-B Glide floss (n=5), using a vacuum with a high-efficiency particulate air (HEPA) filter (n=3), eating food prepared with nonstick cookware (n=1), eating microwave popcorn (n=1), and not using air freshener (n=1). The question about avoiding fish with high pollution levels was asked only of participants who first indicated that they consumed fish or seafood (n=67). All scales are ordered such that the darkest part of the scale is the protective environmental health action; in some cases, the protective action is not performing an exposure-related behavior (e.g., not eating microwave popcorn). Symbols indicate p-values from Wilcoxon-Pratt signed-rank tests (PFAS-related and dust-related behaviors) or McNemar’s test (other behaviors): *<0.05, **<0.01, ***<0.001. Summary data are available in Table S4.