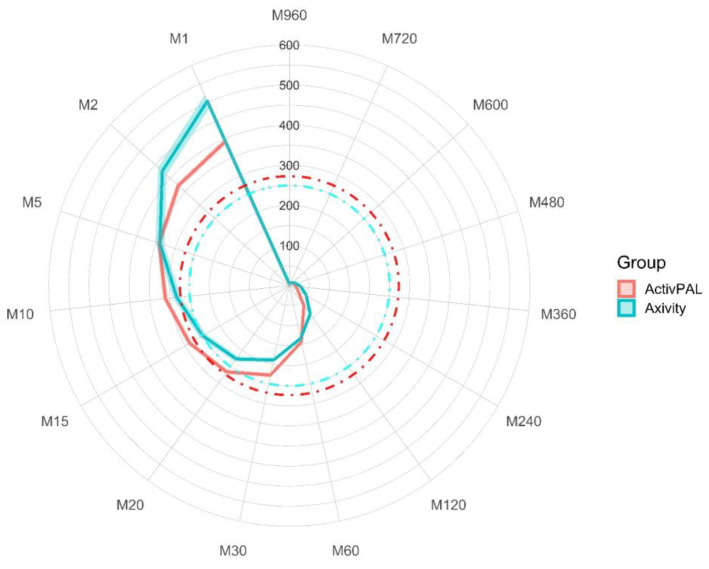
Figure 3.
MX values for both devices. Mean MX values are expressed as milli-gravitational units. Shaded error represents 95% confidence intervals. The red dashed line is indicative of a moderate-to-vigorous activity threshold for the ActivPAL, and the blue dashed line is indicative of a brisk walking pace for the Axivity. MX, most active X minutes from any point in the 24 h day.

