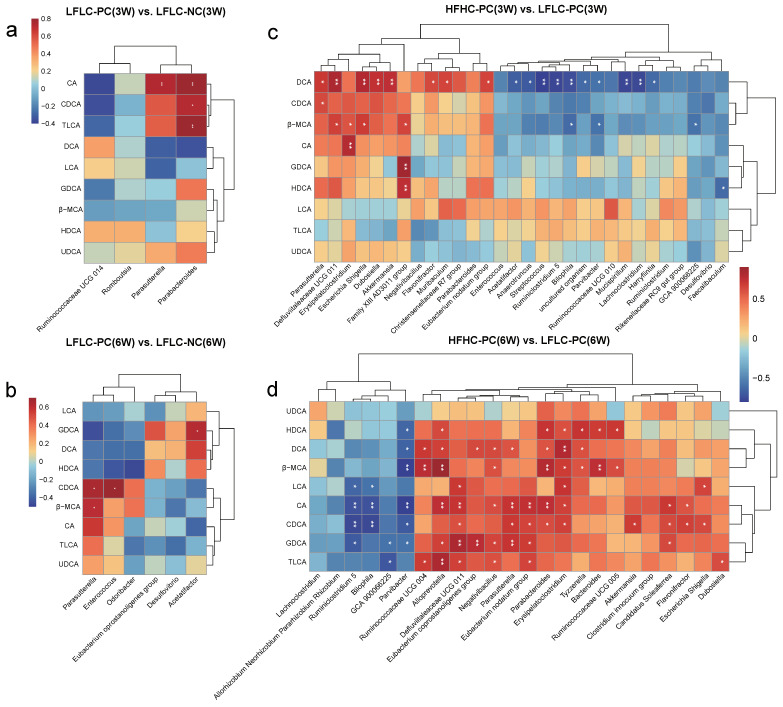
Figure 5.
Effect of different diets and PC on BA metabolism in relation to gut microbiota. (a,b): Spearman’s correlation between gut microbiota and fecal BAs in LFLC−PC vs. LFLC−NC groups at weeks 3 (a) and 6 (b). (c,d): Spearman’s correlation between gut microbiota and BAs in HFHC−PC vs. LFLC−PC groups at weeks 3 (c) and 6 (d). Red denotes a positive correlation; blue denotes a negative correlation. The color intensity is proportional to the strength of the Spearman’s correlation. * p ≤ 0.05, ** p ≤ 0.01.

