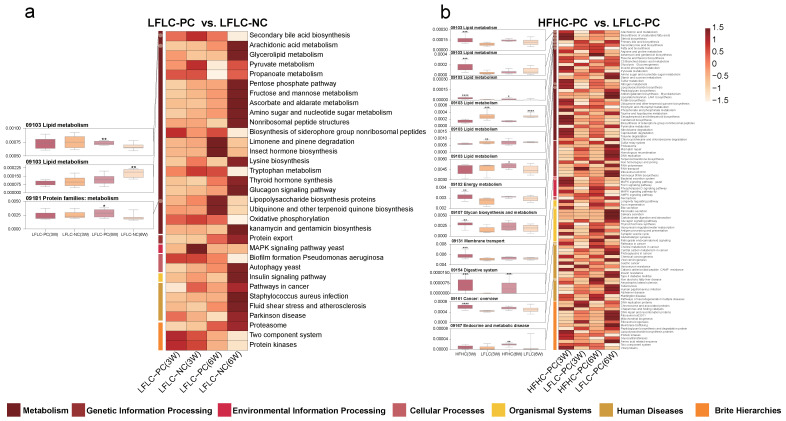
Figure 6.
HFHC diets and PC altered gut microbiota metabolism in mice. PICRUSt analysis in the KEGG pathways. (a): HFHC−PC vs. LFLC−PC groups (at weeks 3 and 6). (b): LFLC−PC vs. LFLC−NC groups (at weeks 3 and 6). The boxplots (left) show the relative abundance of the metabolic pathway of the HFHC−PC, LFLC−PC, and LFLC−NC groups (at weeks 3 and 6). All boxplots represent the min to max of the distribution; the median is shown as a thick line in the middle of the box. Heat maps (right) show differential metabolic pathways between the two groups (a: top 60 pathways). The color indicates the median relative abundance of the metabolic pathway in the group. Mann–Whitney test was used for comparison between the two groups (p < 0.05). * p < 0.05, ** p < 0.01, *** p < 0.001, **** p < 0.0001.

