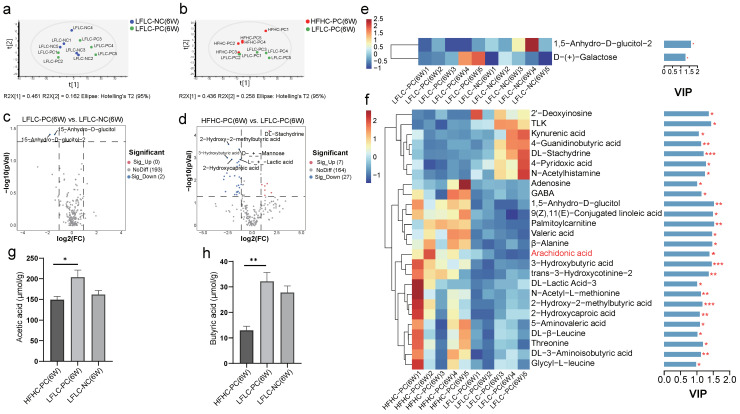
Figure 7.
HFHC diet and PC altered the fecal metabolites in mice. (a,b): Principal component analysis (PCA) at week 6 (LFLC−PC vs. LFLC−NC (a); HFHC−PC vs. LFLC−PC (b)). (c,d): Volcanic map of all differential metabolites and known metabolites (p < 0.05) (LFLC−PC vs. LFLC−NC (c); HFHC−PC vs. LFLC−PC (d)). (e,f): Heat map analysis of fecal differential metabolites at week 6 in HFHC−PC vs. LFLC−PC groups (e) and LFLC−PC vs. LFLC−NC (f). The color indicates the median relative abundance of the metabolite in the group of samples. The metabolite clustering tree is shown on the left. The metabolite variable importance (VIP) in the projected values indicates the contribution of the metabolite to the difference between the two groups, as shown on the right. Higher VIP values indicate greater differences in the composition of that metabolite between the two groups. The differential metabolites were set as not less than 1. (g,h): Acetic acid, Butyric acid. The statistical significance (p−value) of the differential metabolites is marked on the right of the bar chart. p values were determined using a t-test. * p ≤ 0.05, ** p ≤ 0.01, *** p ≤ 0.001.

