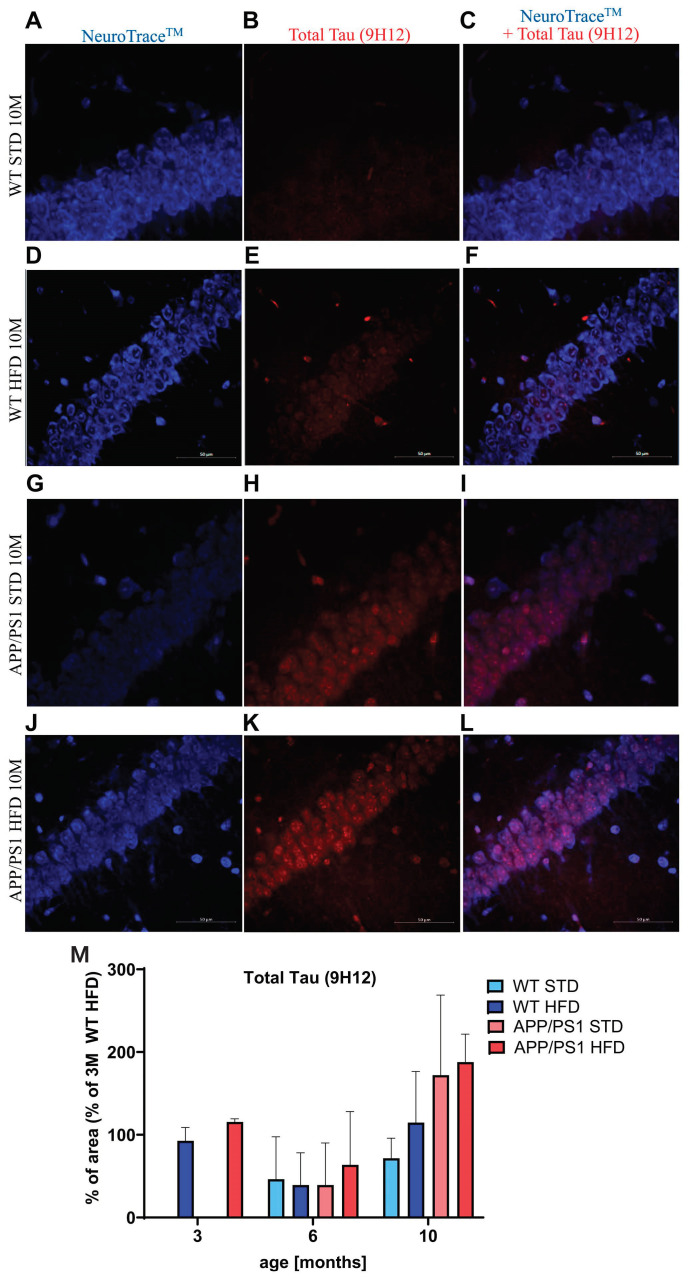
Figure 12.
Accumulation of Tau in the CA1 part of hippocampi of the 10-month-old mice. Representative photomicrographs of the hippocampi of WT mice on STD (A–C), WT mice on HFD (D–F), APP/PS1 mice on STD (G–I) and APP/PS1 mice on HFD (J–L) with NeuroTraceTM (A,D,G,J), total Tau (9H12) (B,E,H,K) and their combination (C,F,I,L) presented. The quantification is shown in (M) and is expressed as a percentage of the 3-month-old WT mice on HFD to enable the comparison of multiple staining series. The data are presented as the means ± SD. Statistical analysis was made via one-way ANOVA with Bonferroni post hoc test (n = 5–8 mice per group).

