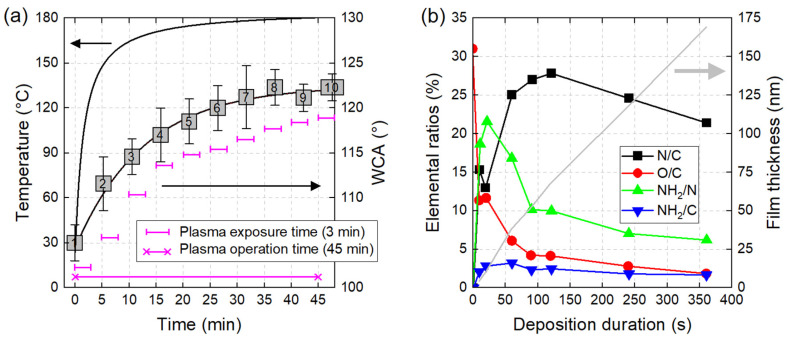
Figure 9.
(a) Influence of plasma operation time on the gas plasma temperature. Ten different PTFE samples are exposed for 3 min to plasma but at different instants and therefore different temperatures. Their WCA values are also reported. (b) Variation of the N/C, O/C, NH2/C and NH2/N ratios as a function of plasma deposition duration. Adapted from [152].

