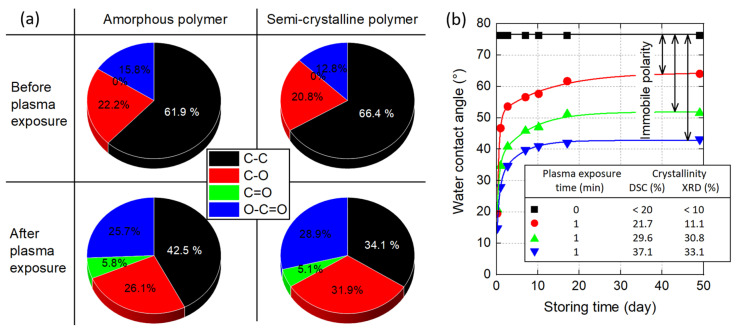
Figure 13.
(a) Functional groups from C 1s spectra versus treatment time for amorphous and semi-crystalline PET foil (C-C at 285.0 eV, C-O at 286.5 eV, C=O at 287.5 eV and O-C=O at 289.0 eV). Adapted from [206]. (b) Effect of crystallinity on the surface dynamics ox oxygen plasma treated PET surfaces. Adapted from [207].

