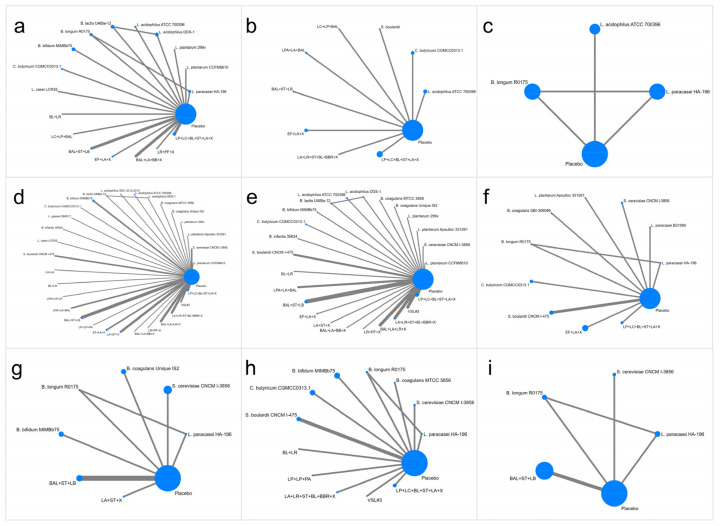
Figure 3.
Network plots for different outcomes. (a). IBS Symptom Severity Scale; (b). IBS-Quality of Life Measure; (c). the Hospital Anxiety and Depression Scale; (d). abdominal pain score; (e). abdominal bloating score; (f). bowel movement frequency (per week) in IBS-D; (g). bowel movement frequency (per week) in IBS-C; (h). Bristol stool form scale in IBS-D; (i). Bristol stool form scale in IBS-C. Different probiotics are represented by nodes. The size of each node is proportional to the number of patients. The width of the edges represents the number of RCTs.

