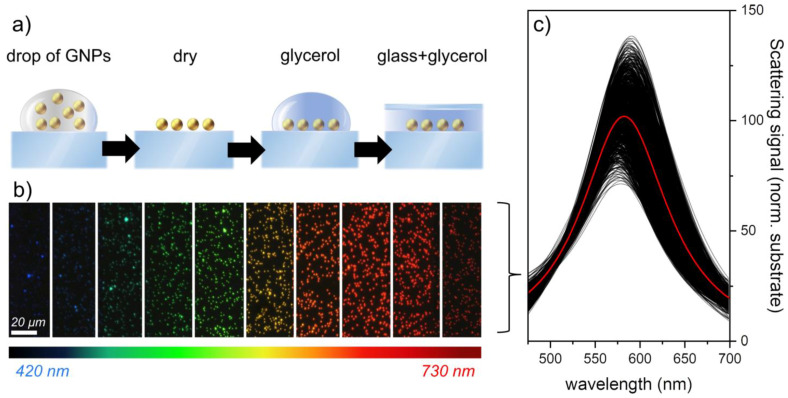
Figure 2.
Sample preparation scheme, spectral images, and scattering spectra of gold nanoparticles (GNPs). (a) Schematic representation of the sample preparation process, in which a 50 μL drop of GNPs at a concentration of 200 μg/mL was deposited on a glass slide, followed by the addition of a 2 μL drop of glycerol and a coverslip. (b) Cropped spectral images obtained for 100 nm particles used to measure the scattering amplitude at different wavelengths. (c) Scattering spectra of approximately 1000 GNPs extracted from the spectral images shown in (b) and normalized to the sample background. The red line represents the average scattering amplitude at each wavelength. The average size of the GNPs, extracted from the amplitude using Equation (1), is 106 ± 10 nm.

