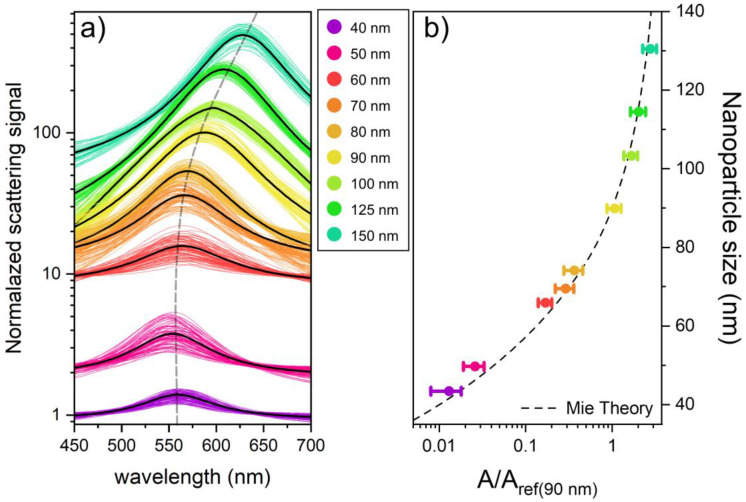
Figure 3.
Spectral analysis and theoretical dependence of the scattering amplitude on the nanoparticle size. (a) Thousands of individual normalized particle spectra are obtained for each batch using the AR-SPS technique, with the mean value represented by the black line. The dotted line marks the spectral shift between batches, and all data have been normalized to the sample background. (b) This graph shows the normalized mean amplitude values for different batches of nanoparticles measured using AR-SPS, with each point value corresponding to a different nanoparticle size. Every point is normalized to a reference batch of 90 nm. The associated error bars show the standard deviation for each measurement. The nanoparticle sizes shown represent the mean values obtained by TEM characterization. A black dashed line on the graph illustrates the theoretical amplitude-to-reference ratio (A/Aref) as a function of the nanoparticle size, as derived from Equation (1).

