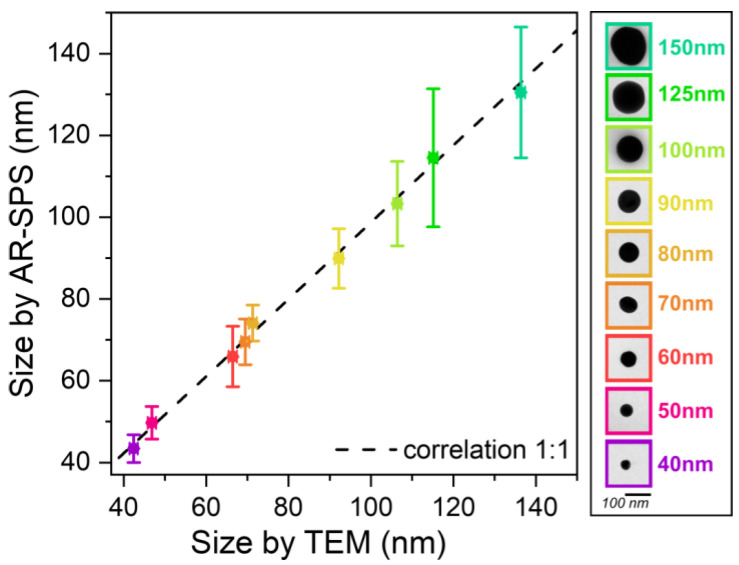
Figure 4.
Correlation between nanoparticle size values obtained by AR-SPS and those obtained by TEM. The legend shows the nominal values for each batch, along with an image of a single nanoparticle taken by TEM. The points follow a very near-ideal linear relationship, represented by the black dashed line; in fact, when a linear fit is performed, the resulting slope has a value of 0.94.

