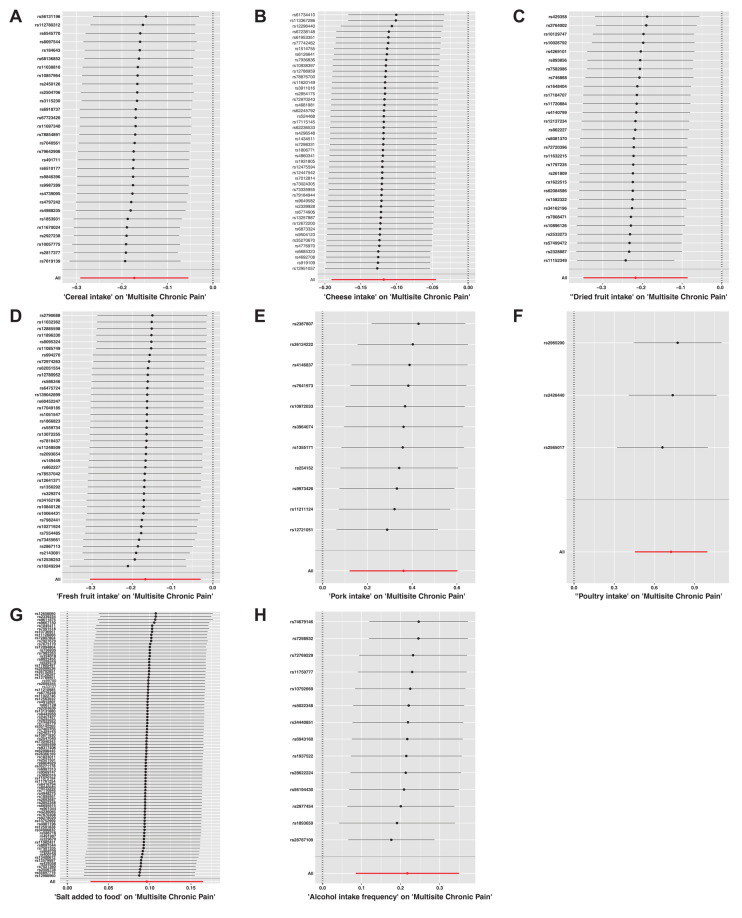
Figure 5.
The results of a leave-one-out analysis on Mendelian randomization (MR). Each black line in the figure corresponds to the outcome of the MR analysis when one single nucleotide polymorphism (SNP) is removed from the analysis, while the remaining SNPs are used on the left. (A) Leave-one-out analysis between cereal intake and multisite chronic pain; (B) Leave-one-out analysis between cheese intake and multisite chronic pain; (C) Leave-one-out analysis between dried fruit intake and multisite chronic pain; (D) Leave-one-out analysis between fresh fruit intake and multisite chronic pain; (E) Leave-one-out analysis between pork intake and multisite chronic pain; (F) Leave-one-out analysis between poultry intake and multisite chronic pain; (G) Leave-one-out analysis between salt added in food and multisite chronic pain; (H) Leave-one-out analysis between alcohol intake frequency and multisite chronic pain. Red line reference the overall effect.

