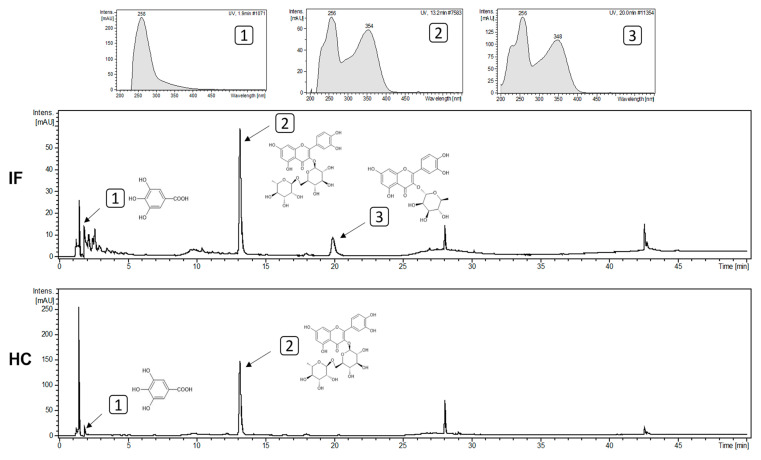
Figure 5.
Chromatographic profile of the leaf infusion (IF) and the hydroethanolic extract of the fruit peels (HC) of T. esculenta obtained through the analysis with CLAE-DAD at a wavelength of 352 nm. Each number indicates a different molecule. In the chromatograms, peak 1 corresponds to gallic acid, peak 2 corresponds to rutin, and peak 3 to quercitrin. The molecule structure of the identified peaks are drawn. The x-axis corresponds to the retention time (min) of each peak, and the y-axis corresponds to the intensity of the peaks in mAU.

