
Figure 12.
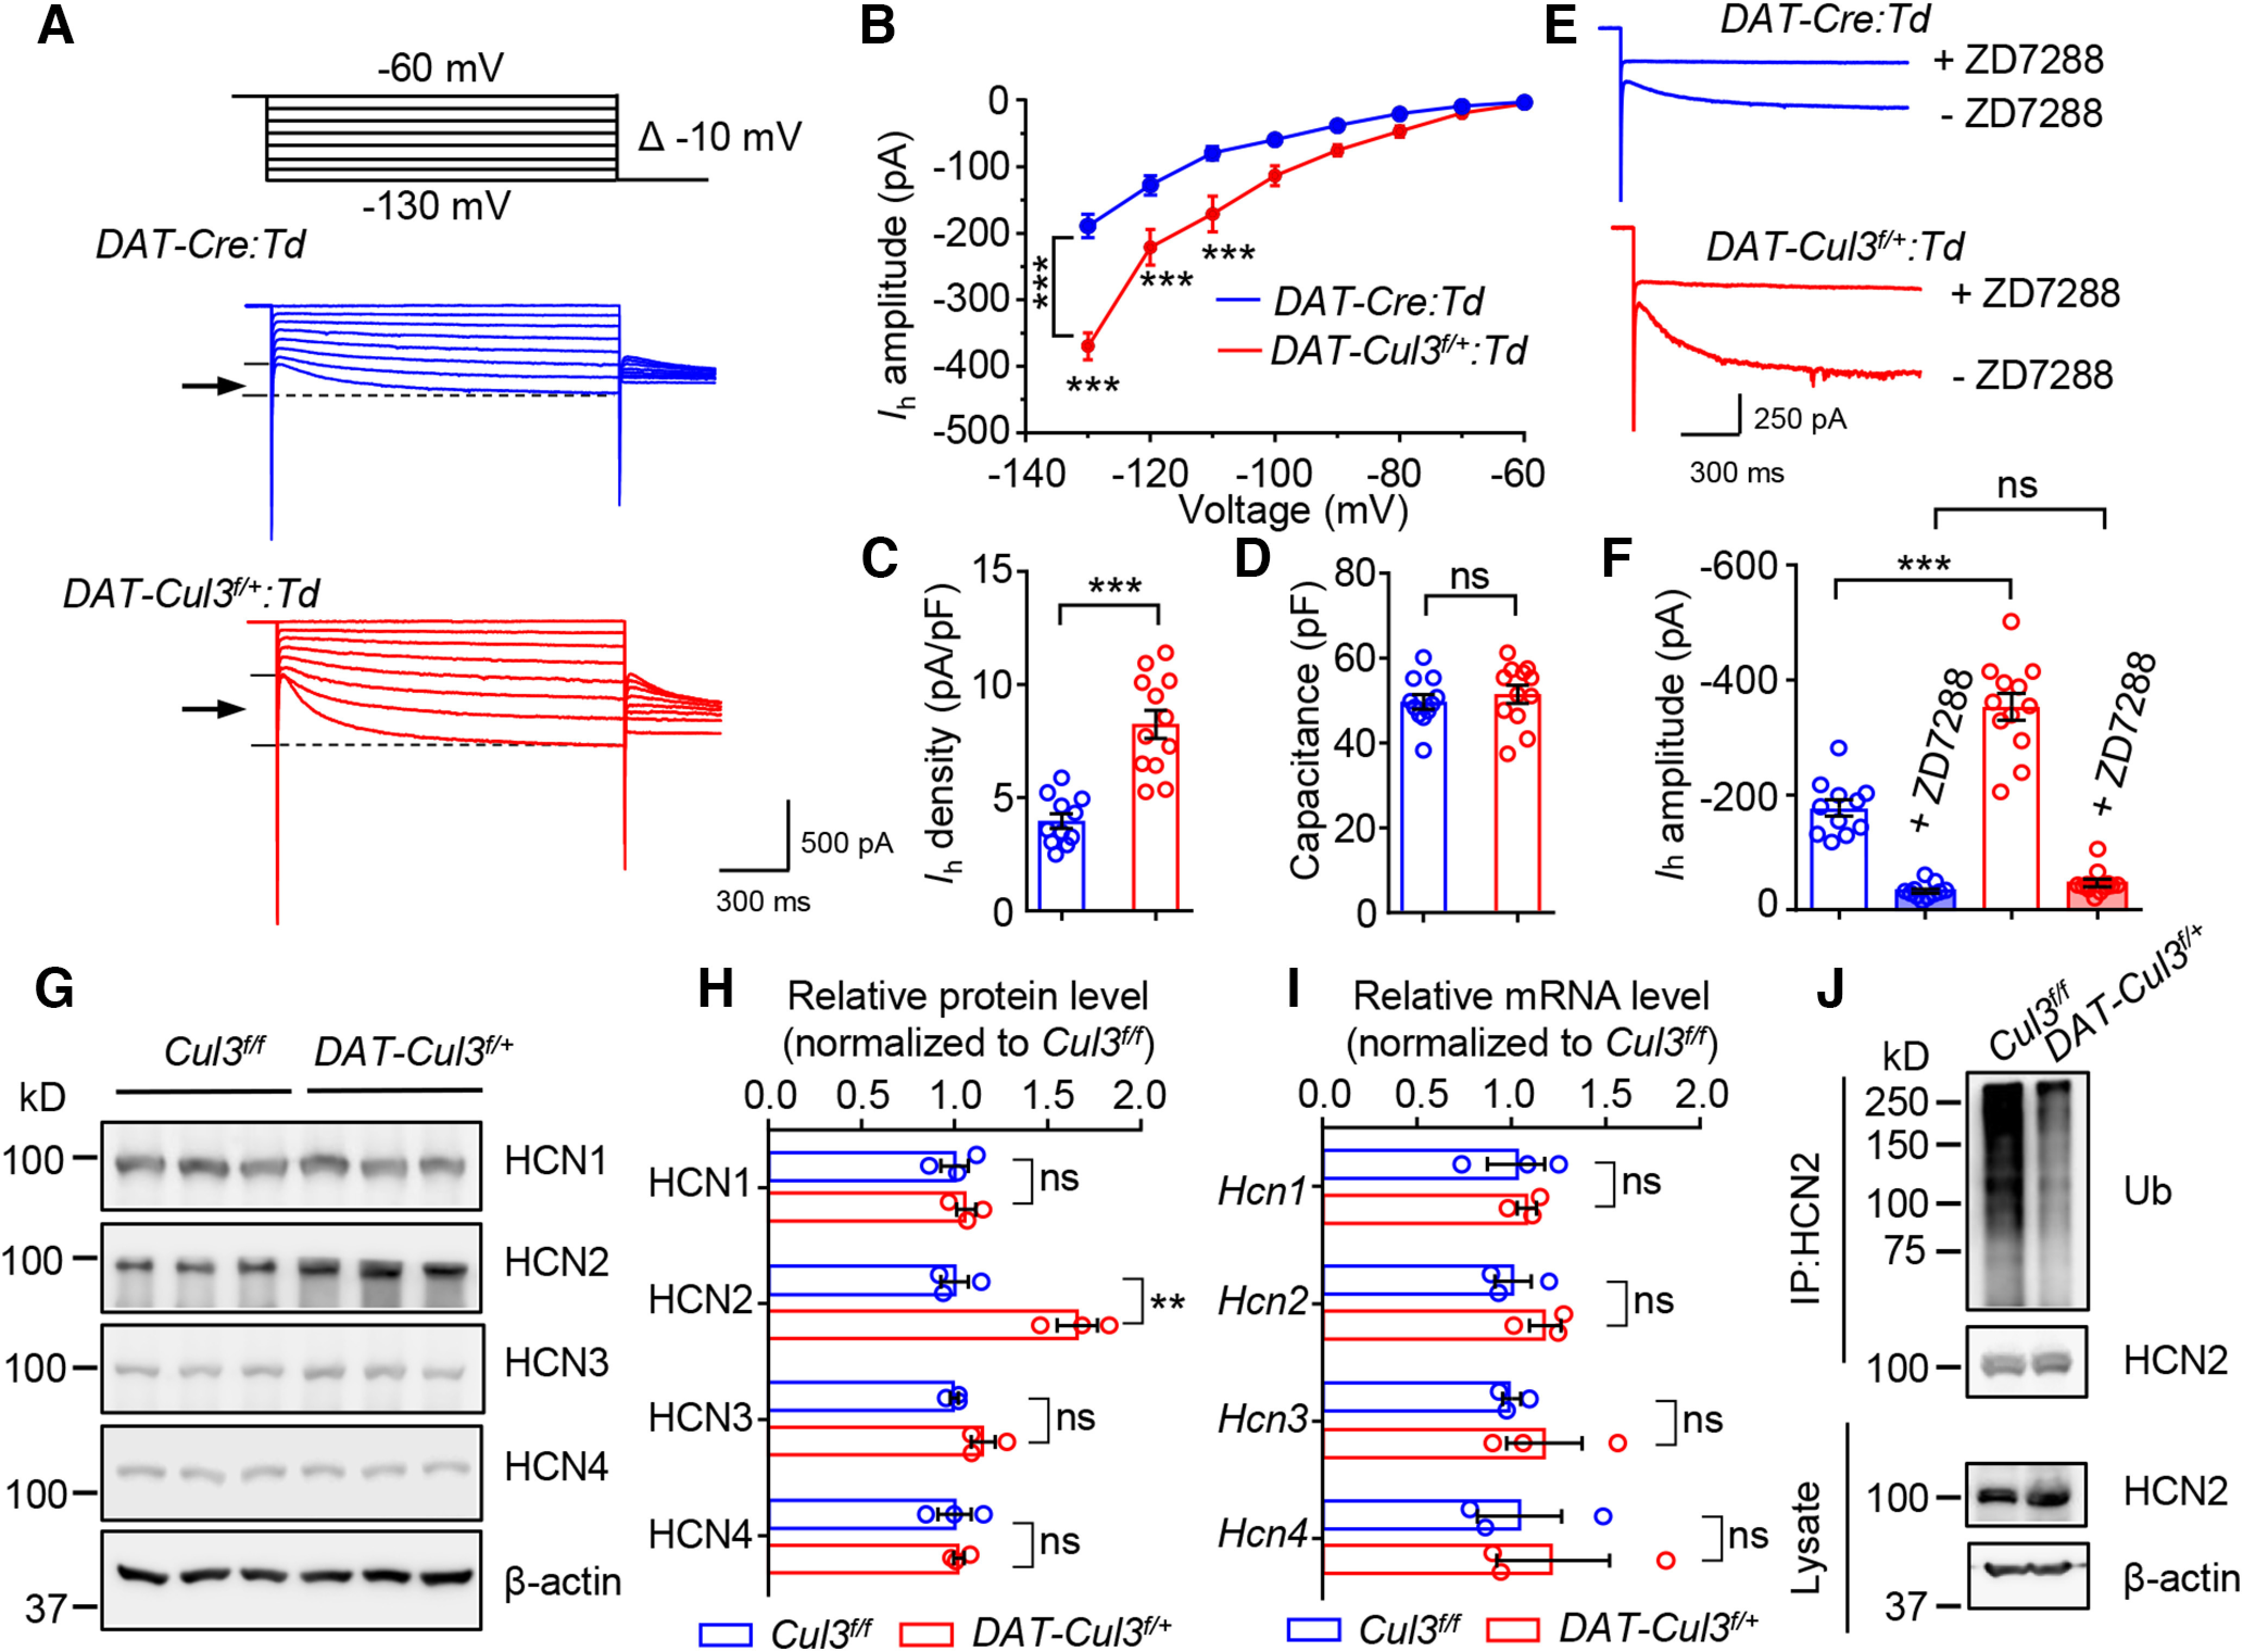
Increased function and expression of HCN2 channel in DAT-Cul3f/+ mice. A, Representative traces of Ih. B, Increased amplitude of Ih in DAT-Cul3f/+:Td VTA DA neurons. n = 11 neurons, 4 mice for DAT-Cre:Td group; n =12 neurons, 4 mice for DAT-Cul3f/+:Td group; p = 0.0001, F(genotype)(1,21) = 21.71; two-way ANOVA followed by Bonferroni's post hoc test. C, Increased density of Ih in DAT-Cul3f/+:Td DA neurons. n = 11 neurons, 4 mice for DAT-Cre:Td group; n = 12 neurons, 4 mice for DAT-Cul3f/+:Td group; p < 0.0001, t(16.64) = 6.103; unpaired t test. D, Comparable capacitance. n = 11 neurons, 4 mice for DAT-Cre:Td group; n =12 neurons, 4 mice for DAT-Cul3f/+:Td group; p = 0.52, t(20.69) = 0.6545; unpaired t test. E, Representative traces of Ih in the presence of HCN channel inhibitor ZD7288. F, Similar amplitude of Ih in the presence of ZD7288. n = 11 neurons, 4 mice for DAT-Cre:Td group; n =12 neurons, 4 mice for DAT-Cul3f/+:Td group; DAT-Cre:Td versus DAT-Cul3f/+:Td, p < 0.0001, t(18.21) = 6.408; DAT-Cre:Td + ZD7288 versus DAT-Cul3f/+:Td + ZD7288, p = 0.0801, t(18.19) = 1.854; unpaired t test. G, Increased levels of HCN2 protein in VTA/SNc of P60 DAT-Cul3f/+ mice compared with control mice. H, Quantification of data in G. n = 3 mice for each genotype; for HCN1, p = 0.5248, t(4) = 0.6960; for HCN2, p = 0.0072, t(4) = 5.066; for HCN3, p = 0.0873, t(4) = 2.253; for HCN4, p = 0.8166, t(4) = 0.2476; unpaired t test. I, Unchanged mRNA levels of Hcn1-4 in VTA/SNc of DAT-Cul3f/+ mice. n = 3 mice per group; for Hcn1, p = 0.7356, t(4) = 0.3621; for Hcn2, p = 0.2533, t(4) = 1.333; for Hcn3, p = 0.4457, t(4) = 0.845; for Hcn4, p = 0.6551, t(4) = 0.4818; unpaired t test. J, Decreased ubiquitination of HCN2 in VTA/SNc of DAT-Cul3f/+ mice. Data are mean ± SEM. **p < 0.01. ***p < 0.001.