Figure 4.
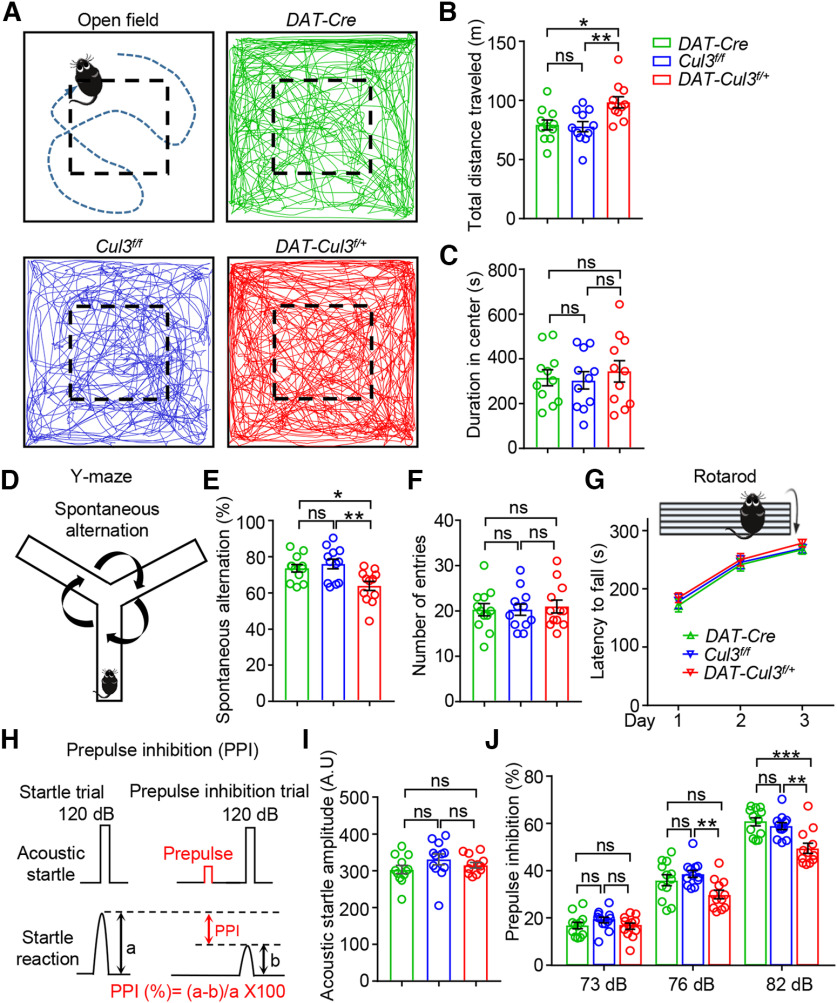
Increased locomotion, impaired working memory, and decreased sensorimotor gating in DAT-Cul3f/+ mice. A, Schematic diagram of the open field test and representative traces of movement over 30 min in the arena (50 × 50 × 20 cm) for mice of indicated genotypes. B, Increased distance traveled by DAT-Cul3f/+ mice compared with DAT-Cre mice or Cul3f/f mice. n = 11 mice per group; DAT-Cre versus Cul3f/f, p = 0.9709; DAT-Cre versus DAT-Cul3f/+, p = 0.0117; Cul3f/f versus DAT-Cul3f/+, p = 0.0065; F(2,30) = 6.871; one-way ANOVA followed by Tukey's post hoc test. C, Similar time spent in the central area of the open field by DAT-Cul3f/+ mice. n = 11 mice per group; DAT-Cre versus Cul3f/f, p = 0.9797; DAT-Cre versus DAT-Cul3f/+, p = 0.8652; Cul3f/f versus DAT-Cul3f/+, p = 0.7613; F(2,30) = 0.267; one-way ANOVA followed by Tukey's post hoc test. D, Schematic diagram of the Y-maze test. Spontaneous alternation behavior is shown as the mouse's tendency to explore a new arm of the maze instead of returning to one that was previously visited. E, Decreased spontaneous alternation in Y-maze test by DAT-Cul3f/+ mice. n = 12 mice per group; DAT-Cre versus Cul3f/f, p = 0.7781; DAT-Cre versus DAT-Cul3f/+, p = 0.0218; Cul3f/f versus DAT-Cul3f/+, p = 0.0039; F(2,33) = 6.847; one-way ANOVA followed by Tukey's post hoc test. F, Similar total number of entries in Y-maze test. n = 12 mice per group; Cre versus Cul3f/f, p > 0.9999; DAT-Cre versus DAT-Cul3f/+, p = 0.9159; Cul3f/f versus DAT-Cul3f/+, p = 0.9159; F(2,33) = 0.1066; one-way ANOVA followed by Tukey's post hoc test. G, Comparable latency to fall in the Rotarod test. n = 13 mice per group; p = 0.3742, F(genotype)(2108) = 0.9919; two-way ANOVA. H, Schematic diagram of PPI experiment. PPI (%) = (a − b)/a × 100. I, Similar acoustic startle reflex. n = 12 mice per group; Cre versus Cul3f/f, p = 0.2185; DAT-Cre versus DAT-Cul3f/+, p = 0.7511; Cul3f/f versus DAT-Cul3f/+, p = 0.5940; F(2,33) = 1.464; one-way ANOVA followed by Tukey's post hoc test. J, Decreased PPI ratio at 76 and 82 dB in DAT-Cul3f/+ mice. n = 12 mice per group. At 73 dB, Cre versus Cul3f/f, p = 0.4345; DAT-Cre versus DAT-Cul3f/+, p = 0.9841; Cul3f/f versus DAT-Cul3f/+, p = 0.3435; F(2,33) = 1.198. At 76 dB, Cre versus Cul3f/f, p = 0.5942; DAT-Cre versus DAT-Cul3f/+, p = 0.0782; Cul3f/f versus DAT-Cul3f/+, p = 0.0078; F(2,33) = 5.472. At 82 dB, Cre versus Cul3f/f, p = 0.9256; DAT-Cre versus DAT-Cul3f/+, p = 0.0010; Cul3f/f versus DAT-Cul3f/+, p = 0.0027; F(2,33) = 9.765; one-way ANOVA followed by Tukey's post hoc test. Data are mean ± SEM. *p < 0.05. **p < 0.01. ***p < 0.001.

