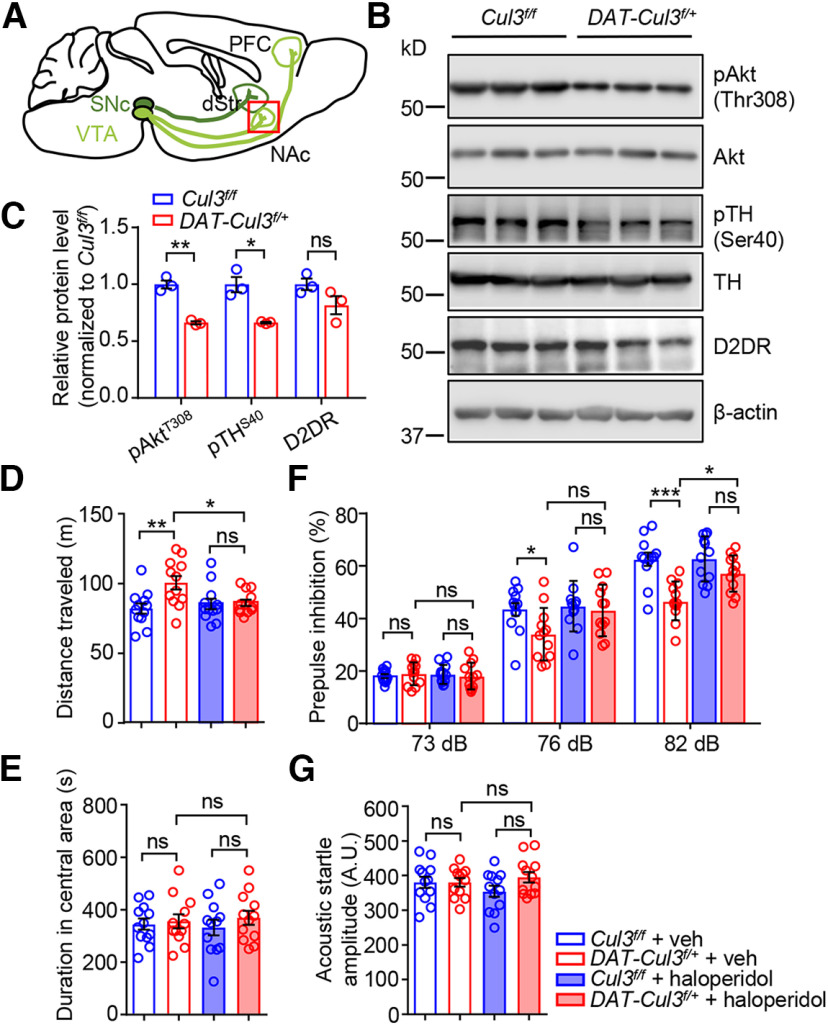
Figure 7.
Increased DA signaling in DAT-Cul3f/+ mice. A, Schematic diagram represents projections of VTA DA neurons (in light green) and SNc DA neurons (in dark green). Red inset represents NAc, showing that this brain region was collected and subjected to experiment in B. dStr, dorsal striatum. B, Reduced levels of pAkr Thr308 and pTH Ser40 in NAc of P60 DAT-Cul3f/+ mice compared with Cul3f/f mice. C, Quantification of data in B. n = 3 mice for each genotype; for pAkt, p = 0.0054, t(2.585) = 8.77; for pTH, p = 0.0382, t(2.025) = 4.906; for D2DR, p = 0.1404, t(3.35) = 1.924; unpaired t test. D, Haloperidol attenuated hyperlocomotion in DAT-Cul3f/+ mice. n = 12 mice for each group; veh-treated Cul3f/f versus veh-treated DAT-Cul3f/+, p = 0.0065; haloperidol-treated Cul3f/f versus haloperidol-treated DAT-Cul3f/+, p = 0.9986; veh-treated DAT-Cul3f/+ versus haloperidol-treated DAT-Cul3f/+, p = 0.0473; F(3,44) = 4.72; one-way ANOVA followed by Tukey's post hoc test. E, No difference in time spent in the central area of the open field. n = 12 mice for each group; veh-treated Cul3f/f versus veh-treated DAT-Cul3f/+, p = 0.9918; haloperidol-treated Cul3f/f versus haloperidol-treated DAT-Cul3f/+, p = 0.7333; veh-treated DAT-Cul3f/+ versus haloperidol-treated DAT-Cul3f/+, p = 0.9814; F(3,44) = 0.3802; one-way ANOVA followed by Tukey's post hoc test. F, Haloperidol restored the PPI ratio in DAT-Cul3f/+ mice at 82 dB. n = 12 mice for each group. For 73 dB, veh-treated Cul3f/f versus veh-treated DAT-Cul3f/+, p = 0.9520; haloperidol-treated Cul3f/f versus haloperidol-treated DAT-Cul3f/+, p = 0.9711; veh-treated DAT-Cul3f/+ versus haloperidol-treated DAT-Cul3f/+, p = 0.9436; F(3,44) = 0.1611. For 76 dB, veh-treated Cul3f/f versus veh-treated DAT-Cul3f/+, p = 0.0447; haloperidol-treated Cul3f/f versus haloperidol-treated DAT-Cul3f/+, p = 0.1496; veh-treated DAT-Cul3f/+ versus haloperidol-treated DAT-Cul3f/+, p = 0.6500; F(3,44) = 4.55. For 82 dB, veh-treated Cul3f/f versus veh-treated DAT-Cul3f/+, p < 0.001; haloperidol-treated Cul3f/f versus haloperidol-treated DAT-Cul3f/+, p = 0.3345; veh-treated DAT-Cul3f/+ versus haloperidol-treated DAT-Cul3f/+, p = 0.0130; F(3,44) = 10.58; one-way ANOVA followed by Tukey's post hoc test. G, Similar acoustic startle response. n = 12 mice for each group; veh-treated Cul3f/f versus veh-treated DAT-Cul3f/+, p > 0.9999; haloperidol-treated Cul3f/f versus haloperidol-treated DAT-Cul3f/+, p = 0.2531; veh-treated DAT-Cul3f/+ versus haloperidol-treated DAT-Cul3f/+, p = 0.9088; F(3,44) = 1.225; one-way ANOVA followed by Tukey's post hoc test. Data are mean ± SEM. *p < 0.05. **p < 0.01. ***p < 0.001.

