
Figure 8.
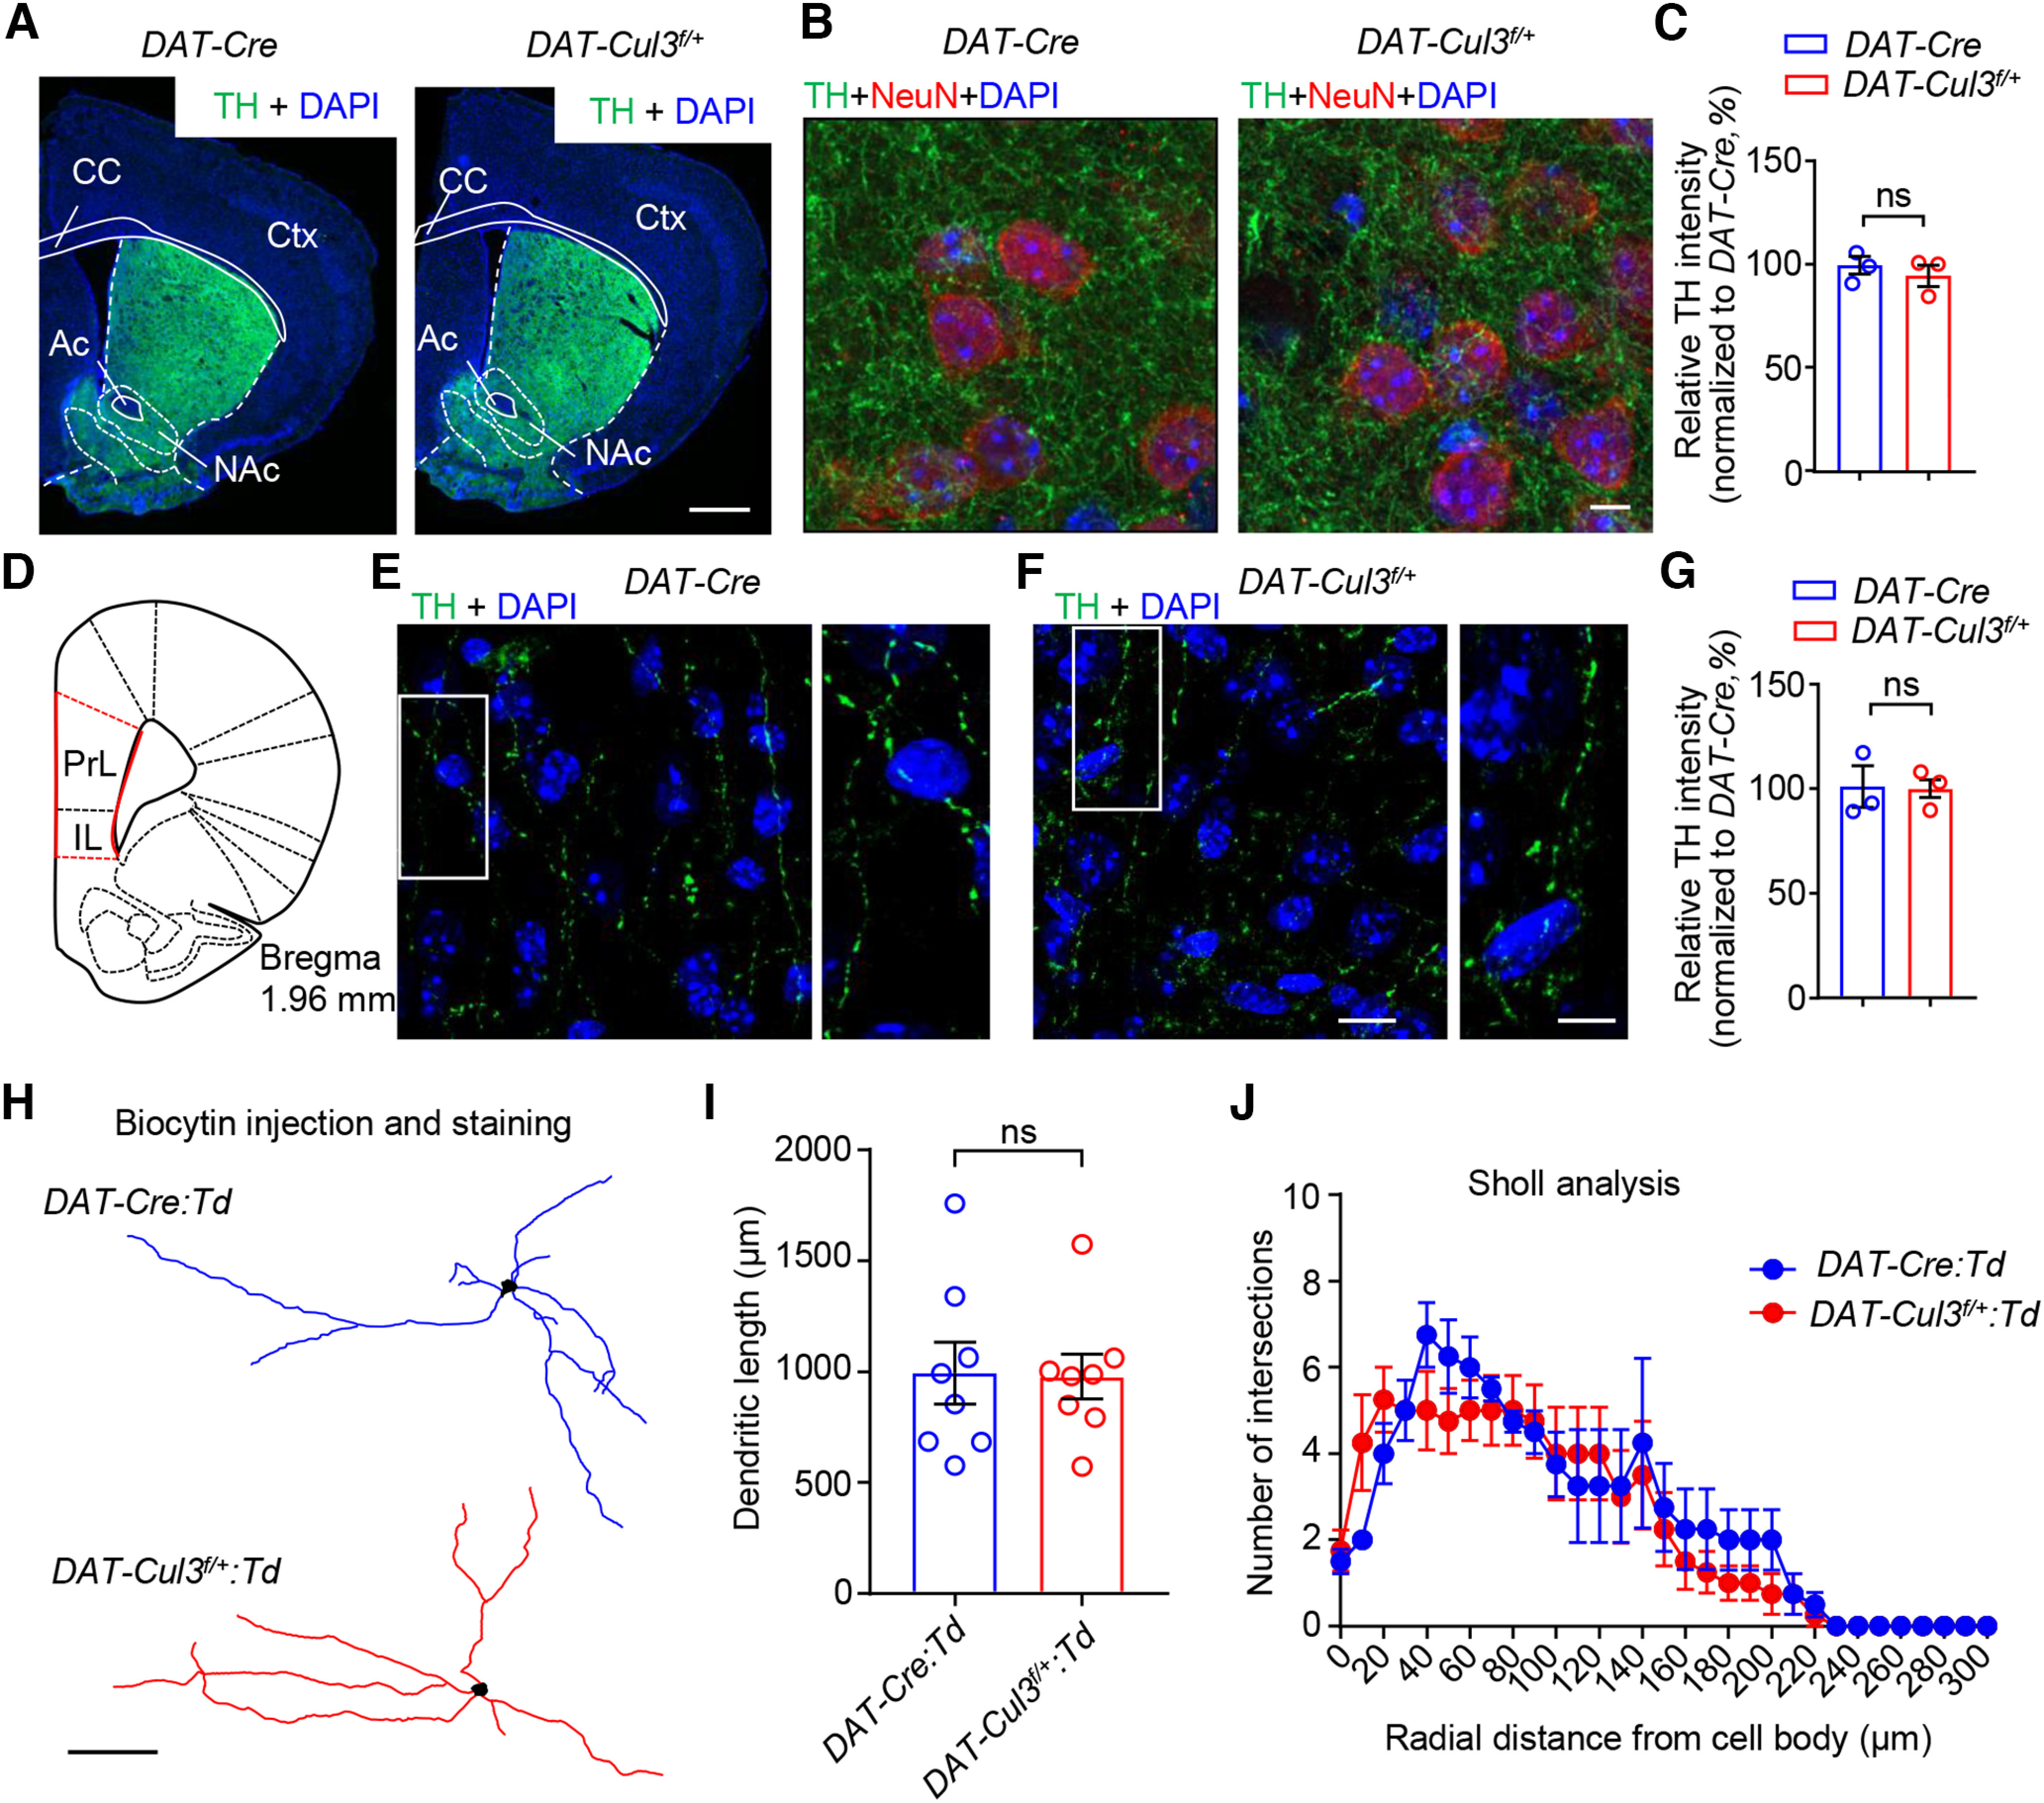
Comparable axon terminals and dendritic morphology of VTA DA neuron in adult DAT-Cul3f/+ mice. A–C, Comparable morphology and TH intensity in the striatum between P60 DAT-Cul3f/+ mice and control. The striatum was stained with antibodies toward TH (green), NeuN (red), and DAPI (blue). A, Representative images of striatum from P60 mice. Scale bar, 500 μm. B, Representative images of NAc from control and DAT-Cul3f/+ mice. Scale bar, 5 μm. C, Quantification of TH intensity in NAc. n = 3 mice per genotype with 10 ROIs per mouse. p = 0.4879, t(3.836) = 0.7664; unpaired t test. Ac, Anterior commissure; CC, corpus callosum; Ctx, cortex. D, Schematic diagram of a coronal section at bregma 1.96 mm indicating the location of mPFC (red lines). PrL, Prelimbic cortex; IL, infralimbic cortex. E–G, No difference in TH intensity in mPFC between adult DAT-Cul3f/+ mice and control. E, F, Representative images of mPFC from P60 mice. mPFC was stained with TH (green) and DAPI (blue). Right, Enlarged images from the insets. Scale bars: left panels, 10 μm; right panels, 5 μm. G, Quantification of TH intensity in mPFC. n = 3 mice per genotype with 10 ROIs per mouse. p = 0.9320, t(2.752) = 0.0934; unpaired t test. H, Representative reconstruction of VTA DA neurons of P60 DAT-Cre:Td and DAT-Cul3f/+:Td mice. DA neurons were labeled with biocytin after whole-cell patch recording in brain slices. Scale bar, 100 μm. I, No difference in total length of dendrites. n = 8 neurons of 3 mice per genotype, p = 0.9250, t(12.78) = 0.0960; unpaired t test. J, Similar complexity of dendrite in control and DAT-Cul3f/+ mice by Sholl analysis. n = 8 neurons of 3 mice per genotype; p = 0.3362, F(1186) = 0.9296; two-way ANOVA. Data are mean ± SEM.