Figure 9.

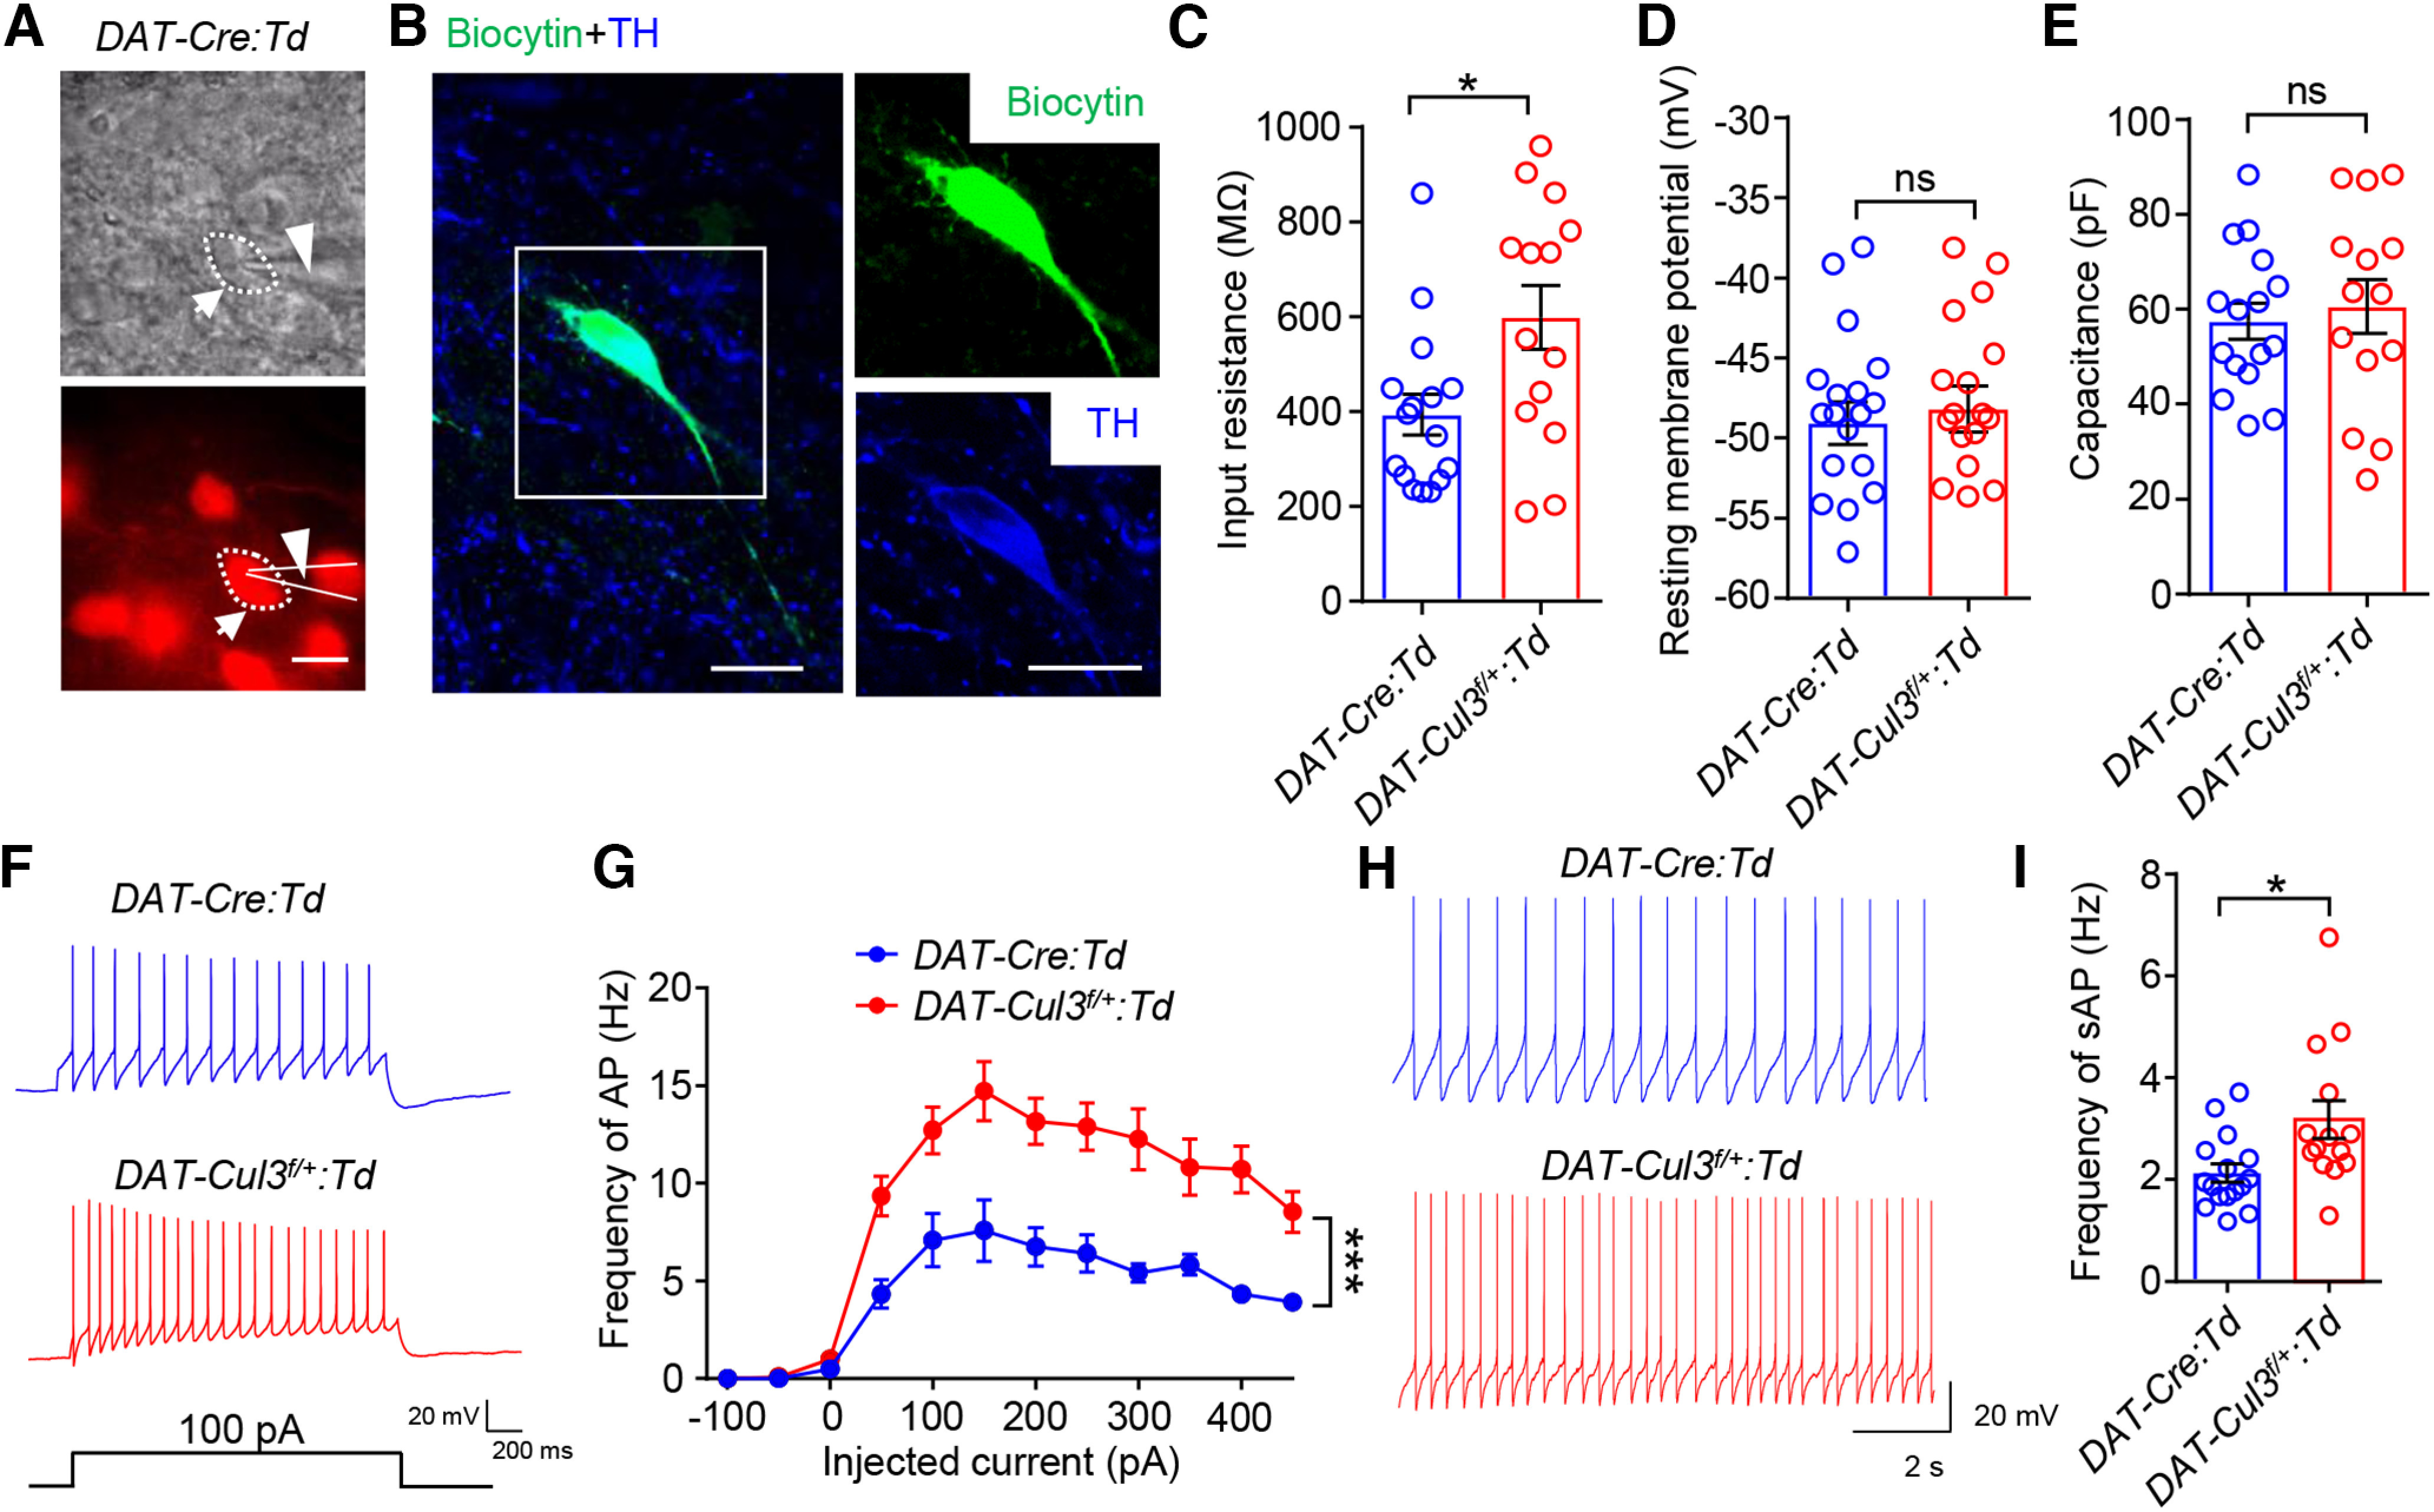
Increased VTA DA neuron excitability in DAT-Cul3f/+ mice. A, Image of a patched VTA DA neuron in a brain slice and the electrode. Top, Bright field image. Bottom, Fluorescent image for the same field. Red signal indicates tdTomato (Td). Scale bar, 20 μm. B, Verification of recorded DA neurons by post hoc immunostaining toward injected biocytin using Alexa-488 conjugated streptavidin. Left, Confocal image of a biocytin-filled DA neuron (green) and TH staining (blue). Right, Enlarged image for biocytin (top) and TH (bottom) for the inset. Scale bar, 20 μm. C, Increased membrane resistance of DAT-Cul3f/+:Td VTA DA neuron. n = 16 neurons, 4 mice for DAT-Cre:Td group; n = 14 neurons, 4 mice for DAT-Cul3f/+:Td group; p = 0.0183, t(22.4) = 2.545; unpaired t test. D, Comparable resting membrane potentials of VTA DA neurons. n = 16 neurons, 4 mice for DAT-Cre:Td group; n = 14 neurons, 4 mice for DAT-Cul3f/+:Td group; DAT-Cre:Td (−48.63 ± 1.5 mV) versus DAT-Cul3f/+:Td (−48.03 ± 1.8 mV), p = 0.8014, t(26.39) = 0.2541; unpaired t test. E, Similar capacitance. n = 16 neurons, 4 mice for DAT-Cre:Td group; n = 14 neurons, 4 mice for DAT-Cul3f/+:Td group; p = 0.6077, t(21.33) = 0.5211; unpaired t test. F, Representative traces of spikes evoked by injection of depolarizing currents. G, Increased firing rate evoked by current injection of DAT-Cul3f/+:Td VTA DA neuron. Firing rate was plotted against increasing currents. n = 12 neurons, 4 mice for DAT-Cre:Td group; n = 11 neurons, 4 mice for DAT-Cul3f/+:Td group; p < 0.0001, F(genotype)(1,21) = 33.52; two-way ANOVA. H, Representative traces of spontaneous spikes. I, Increased frequency of spontaneous firing of APs of DAT-Cul3f/+:Td VTA DA neuron. n = 16 neurons, 4 mice for DAT-Cre:Td group; n = 14 neurons, 4 mice for DAT-Cul3f/+:Td group; p = 0.0203, t(18.77) = 2.536; unpaired t test. Data are mean ± SEM. *p < 0.05.
