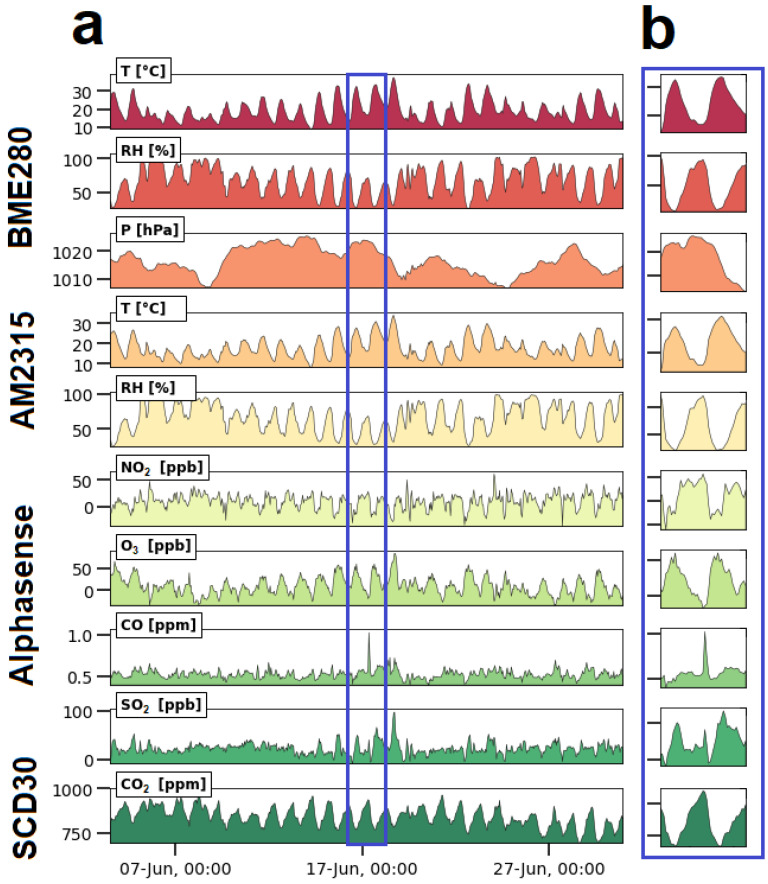
Figure 5.
Time series plots of the outdoor air monitoring at the VMM station in Antwerp, Belgium using a low-cost monitoring system from 3 to 30 June 2022. The plots show the occurrence of meaningful trends in the graphs, from which information can be extracted. (a) Plot of the entire measurement campaign; (b) Detail of the measurement campaign located in the blue rectangle in figure a.

