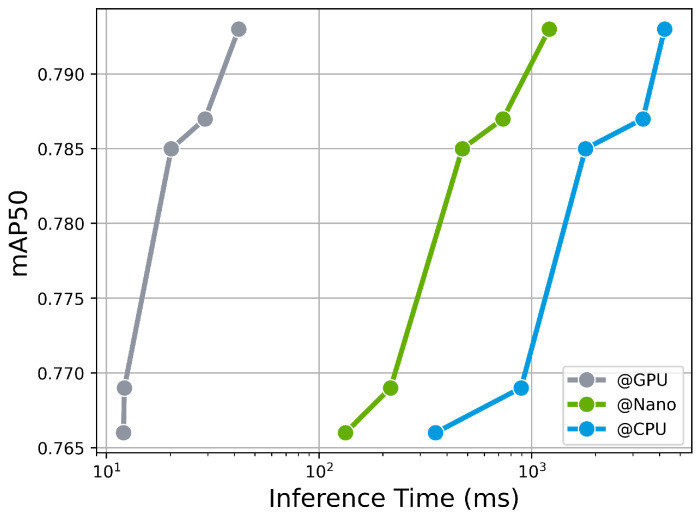
Figure 9.
Trade-off between inference time and detection accuracy in different environments. The x-axis represents the inference time and the y-axis represents the detection accuracy as mAP50. It showcases the trends in inference speed and detection performance for different sizes of YOLOv8 under different computing environments as follows: “@GPU” refers to the Nvidia Tesla T4, “@Nano” refers to the Nvidia Jetson Nano, and “@CPU” refers to the Intel Xeon processor.

