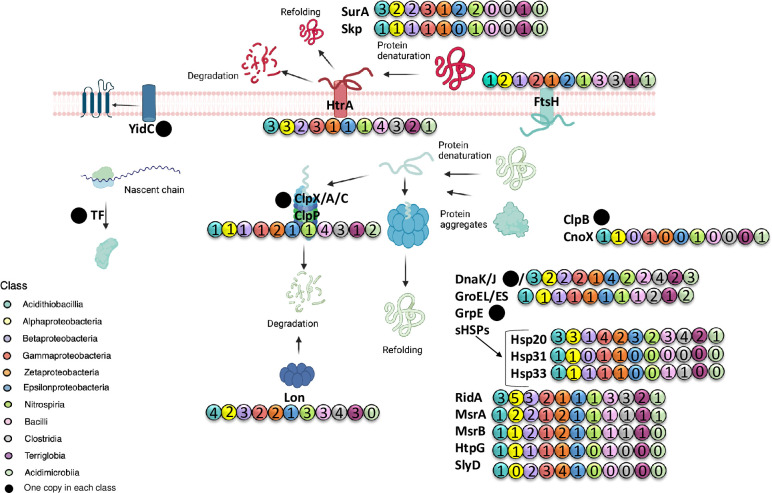
Fig 7. Schematic representation of predicted proteostasis networks in acidophiles.
The prediction of genetic products was derived from 40 genomic sequences of heterotrophic, autotrophic, and mixotrophic acidophilic microorganisms. Numbers represent the copies detected in every class. Colors represent the corresponding bacterial class.

