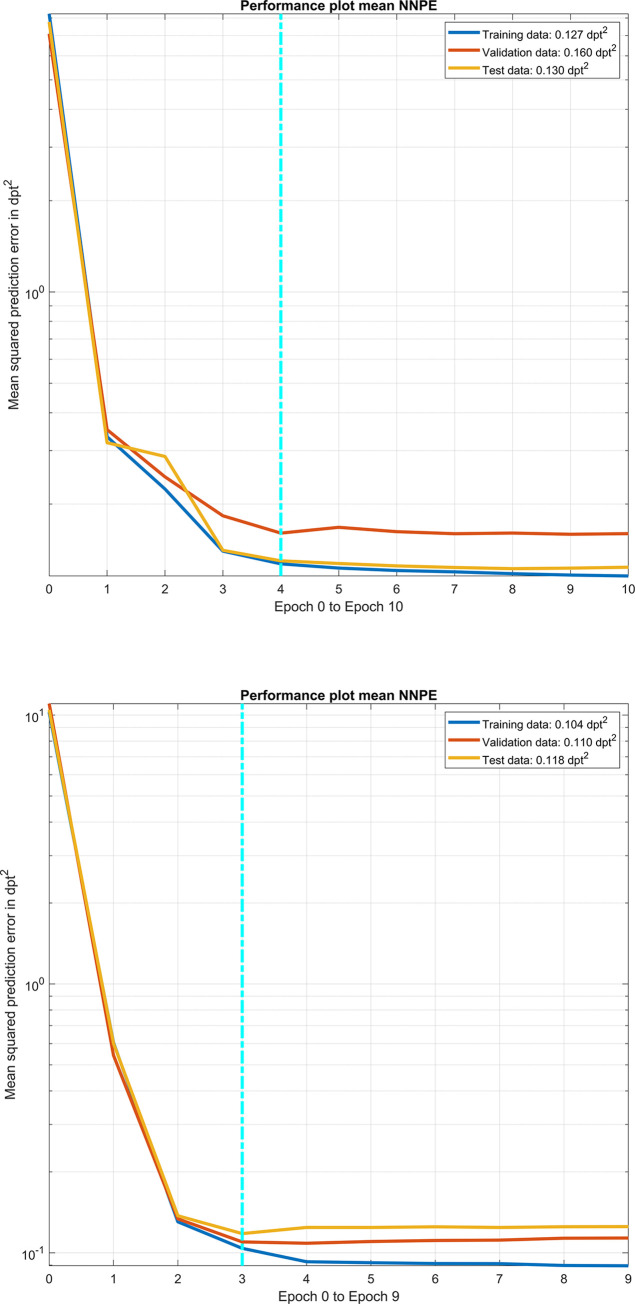
Fig 2. Performance plot of our final version of the feedforward neural network with 2 hidden layers and 10/8 neurons per layer with the mean squared prediction error of the network applied to the training data, validation data and test data for variations of iterations (epochs).
Targeting to the power vector components of the postoperative CASIA real power measurement, the upper graph / lower graph shows the performance of the prediction made with the power vector components of the preoperative IOLM / CASIA keratometric power measurement. The mean squared prediction error for the training, validation, and test data are provided for the best epoch (iteration) indicated by the vertical dashed cyan line in the figure legend.

