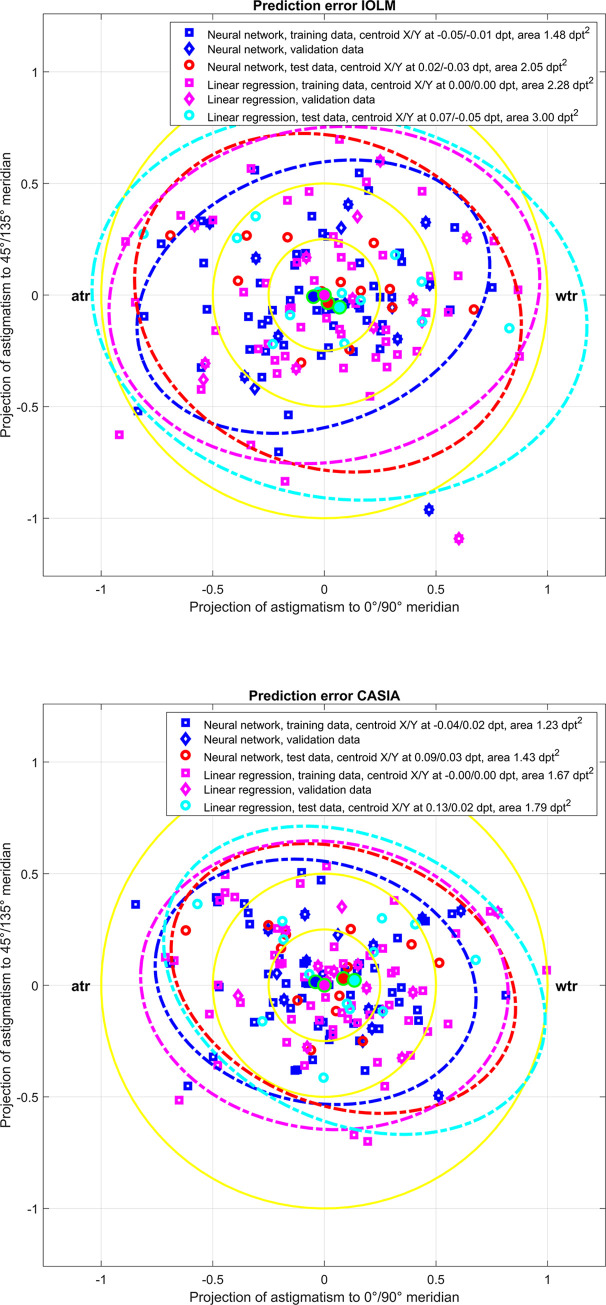
Fig 3. Double angle plots of prediction error (difference between the C0 and C45 power vector components derived from the postoperatively measured CASIA real power and the respective components predicted with the feedforward shallow neural network or the multivariate linear regression) for the entire dataset (N = 88).
In the upper graph the prediction error is displayed for the situation that the feedforward neural network or the multivariate linear regression is based on the power vector components of the preoperative IOLM measurement (keratometric power). In the lower graph the prediction error is displayed for the situation that the feedforward neural network or the multivariate linear regression is based on the power vector components of the preoperative CASIA measurement (keratometric power). The graph shows the prediction error separately for the training data (N = 62), the validation data (N = 13), and test data (N = 13). The error ellipses (ellipse area mentioned in the labels) indicate the 90% confidence intervals and the centroids (filled dots, X / Y coordinates mentioned in the legend). The yellow rings indicate astigmatism below 0.25, 0.5, and 1.0 dpt respectively. For left eyes, the C45 power vector components are reversed in sign in order to present the data in the same orientation as for right eyes. ‘wtr’ refers to with-the-rule and ‘atr’ to against-the-rule astigmatism.

