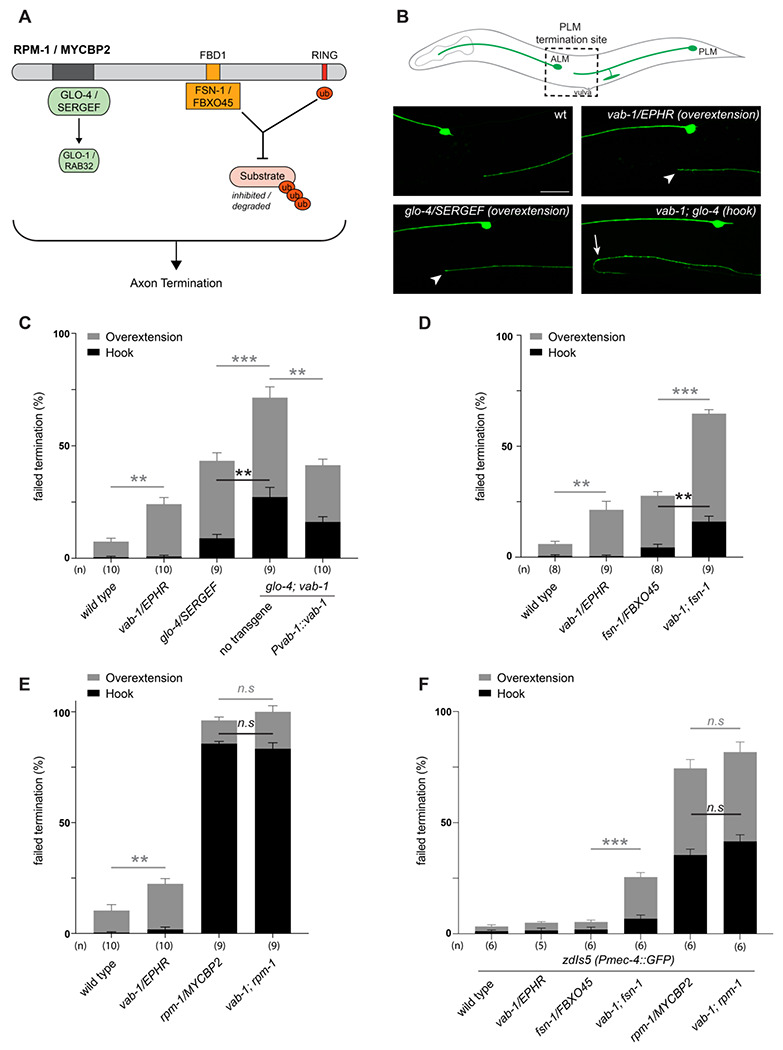
Figure 8. C. elegans VAB-1 ephrin receptor interacts genetically with known RPM-1/MYCBP2 binding proteins FSN-1/FBXO45 and GLO-4/SERGEF.

A) A schematic showing the known RPM-1/MYCBP2 binding proteins GLO-4/SERGEF and FSN-1/FBXO45. GLO-4 functions independent of RPM-1 ubiquitin ligase. FSN-1 is the F-box protein that forms a ubiquitin ligase complex with RPM-1. Adapted from Grill et al., 2016. B) Schematic representation of axon morphology and axon termination site for PLM mechanosensory neurons and representative images of failed axon termination defects observed in PLM neurons for indicated genotypes. Axon termination visualized using muIs32 (Pmec-7::GFP), which expresses GFP in the PLM and ALM mechanosensory neurons. Examples of moderate severity overextension defects (arrowhead) observed in vab-1/EphR and glo-4/SERGEF single mutants. Example of severe overextension (hook) defects (arrow) observed in vab-1; glo-4 double mutants. C) Quantitation of axon termination defects for indicated genotypes using muIs32. vab-1; glo-4 double mutants show enhanced frequency of both hook (black) and overextension (grey) failed termination defects. Overextension defects are significantly reduced by transgenic expression of VAB-1. D) Quantitation of axon termination defects for indicated genotypes. vab-1; fsn-1 double mutants show enhanced termination defects. E) Quantitation of axon termination defects for indicated genotypes using muIs32. Axon termination defects are not suppressed in vab-1; rpm-1 double mutants compared to rpm-1 single mutants. F) zdIs5 (Pmec-4::GFP) was used to quantify axon termination defects for indicated genotypes. vab-1; fsn-1 double mutants show enhanced frequency of overextension defects (grey). Frequency and severity of axon termination defects is not significantly different between vab-1; rpm-1 double mutants and rpm-1 single mutants. n is defined as a single count of 20-30 animals. Means are shown from 8 to 10 counts (20-30 animals per count) for each genotype, and error bars represent SEM. Significance determined using Student’s t-test with Bonferroni correction for multiple comparisons. ** p < 0.01; *** p < 0.001; n.s, not significant. Scale bar is 20 μm.
