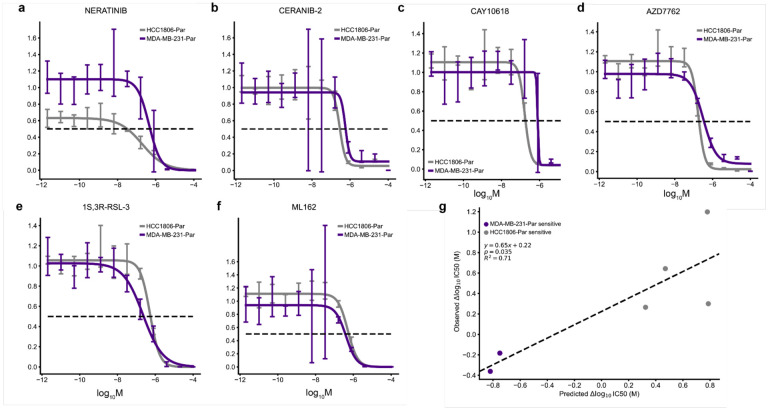
Fig. 4 |. Validation of differential potency predictions.
(a-d) In vitro dose-response relationships of HCC1806-Par differentially potent compounds and (e-f) MDA-MB-231-Par differentially potent compounds. 95% confidence intervals. (g) Relationship between the predicted and observed differences in IC50 values of tested compounds between HCC1806-Par and MDA-MB-231-Par cell lines. Two-sided t-test.

