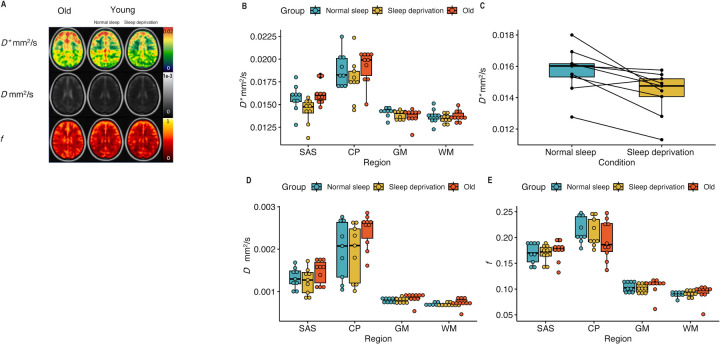
Figure 1:
A. IVIM parameters, , , and in older adults (first column), in young adults with normal sleep (middle column), and the same young adults with sleep deprivation (third column) in the SAS. B. values in all three groups: young adults after a night of normal sleep (blue), young adults after 24 hours of sleep deprivation (yellow), and older adults after normal sleep (red). C. Only was significantly different (p=0.009) after 24 hours of sleep deprivation compared to a night of normal sleep. D, E. , and values in all three groups: young adults after a night of normal sleep (blue), young adults after 24 hours of sleep deprivation (yellow), and older adults after normal sleep (red). No difference was observed with aging. Supplementary figure 1 shows the ROIs generated for this study.

