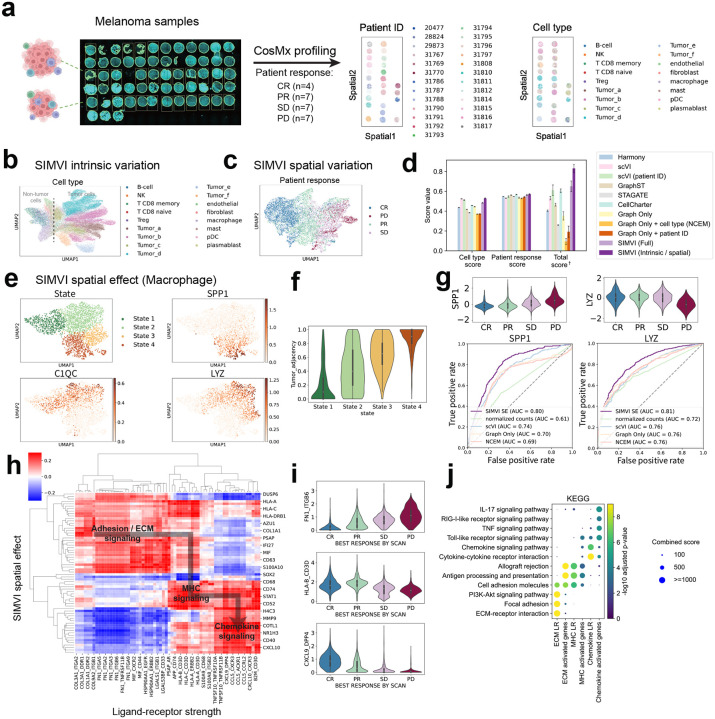
Fig. 6.
SIMVI characterizes macrophage subtypes and reveals cell interaction landscape in cohort-level spatial melanoma profiles. a. Overview of the dataset (left), spatial visualization of the data colored by annotated patient ID and cell types (right). b. UMAP visualization of the SIMVI intrinsic variation, colored by cell types. c. UMAP visualization of the SIMVI spatial variation, colored by response to treatment. The response to treatment was defined as disease progression (PD), stable disease (SD), partial or complete response (PR, CR), as described in prior publications [48]. d. Bar plots showing metric scores for the dataset. The bar heights represent the average performance across 5 different random seeds, with the error bars showing standard errors. †: Each individual metric from all experiments is scaled to the range [0,1], then the final score is calculated as the average of these rescaled values. e. UMAP visualization of the SIMVI spatial effect, colored by annotated states and spatial effect of representative genes. f. Violin plot showing the relative tumor adjacency (defined as the tumor cell ratio within nearest 10 neighbors) across different states. g. Violin plots showing the spatial effect of SPP1 and LYZ grouped by patient outcomes (upper); Receiver Operating Characteristic (ROC) curves comparing SIMVI spatial effects of SPP1 and LYZ and other methods in classifying PD condition. h. Spearman correlation map across representative genes and ligand-receptor pairs. i. Violin plot of representative ligand-receptor strength across patient outcomes. j. Dotplot showing KEGG pathway enrichment analysis of genes and ligand-receptor pairs.

