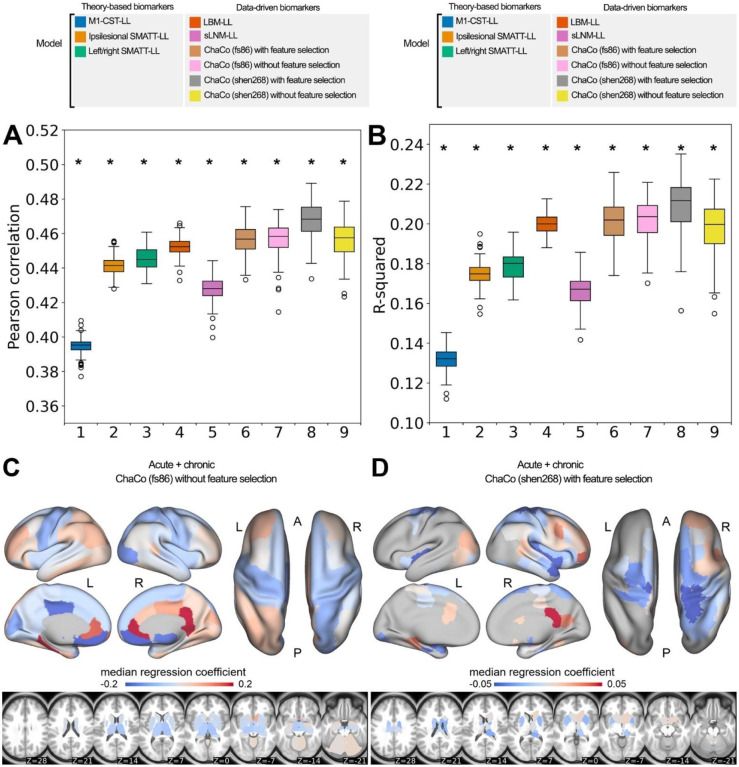
Figure 4. Summary of model performance metrics across all models tested and feature weights (regression coefficients β) for the two best-performing models.
A. and B. Distribution of model performance (mean Pearson correlation/R2 across 5 outer folds for 100 permutations of the data). Asterisks (*) indicate that model performance is significantly above chance (*, p < 0.001), as assessed via permutation testing. The boxes extend from the lower to upper quartile values of the data, with a line at the median. Whiskers represent the range of the data from [Q1–1.5*IQR, Q3+1.5*IQR]. C. and D. Mean feature weights for the top two best-performing models (ChaCo (fs86) without feature selection, ChaCo (shen268) with feature selection, respectively). For the fs86-ChaCo model (left), we display the mean regression coefficients β across 100 permutations. For ChaCo (shen268) (right), we display the median regression coefficients of regions that were selected in at least 95% of outer folds (i.e., for regions that were included in the model in at least 475/500 outer folds, mean β coefficients were calculated across 5 outer folds, and the median value across 100 permutations is plotted).

