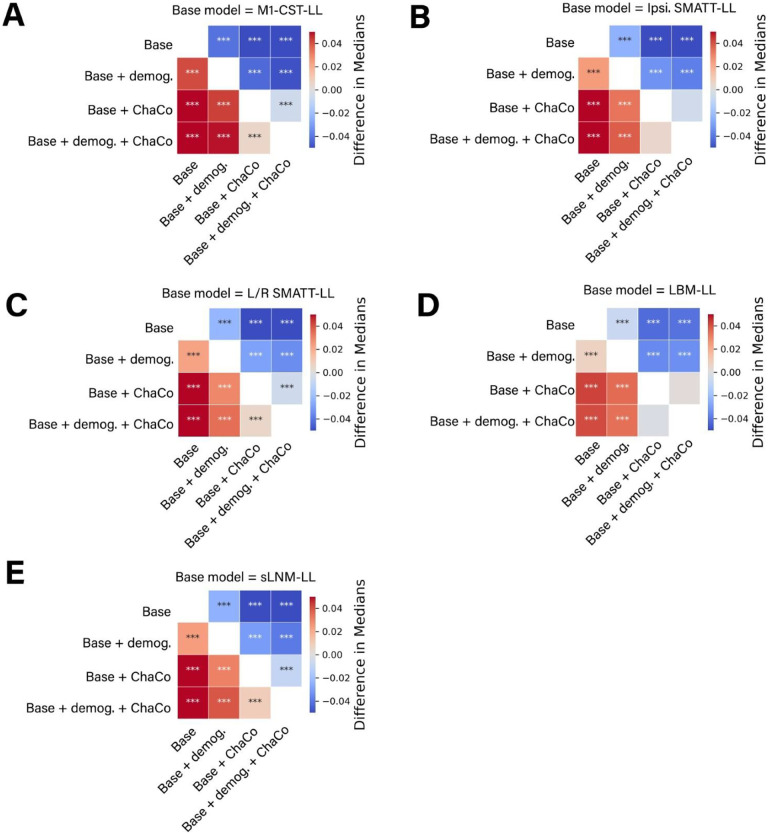
Figure 6. Statistical comparison of model performance for ensemble models.
Demog. = demographic information (age, sex, days since stroke). ChaCo = model using 268-region ChaCo scores w/ feature selection. Significance of differences in explained variance were evaluated using Mann-Whitney signed-rank tests; ***denotes corrected p < 0.001 after Bonferroni correction. A positive difference value indicates that the model on the y-axis (vertical) has a greater explained variance than the model on the x-axis (horizontal).

