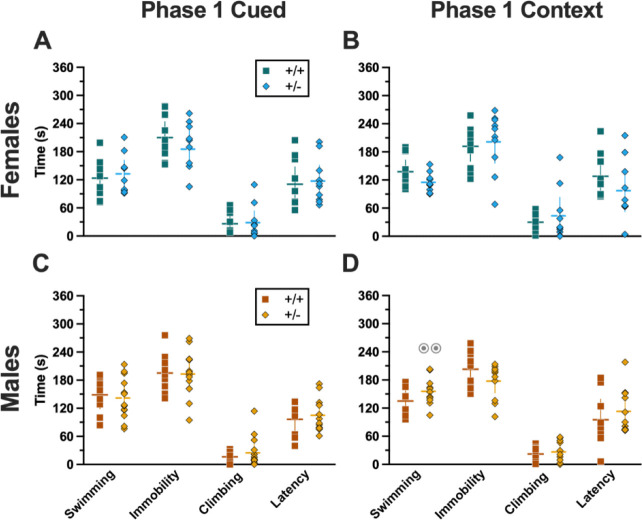
Figure 10.
Behaviors during swim stressor in Phase 1 mice. Mice in Phase 1 assigned to swim stress experienced an acute 6 min swim stressor 4 wks after undergoing Cued (A,C) or Context (B,D) fear conditioning. Female (A-B) wildtypes are represented by teal squares, and female heterozygotes are represented by blue diamonds. Male (C-D) wildtypes are represented by orange squares, and male heterozygotes are represented by yellow diamonds. Data are the amount of time in seconds spent swimming, immobile, or climbing; or the amount of time until the first bout of immobility (i.e., latency). Horizontal lines are shown as the mean, with vertical lines as ± 95% confidence interval. ⊙⊙p=0.003 (panel D) indicates difference between sexes within same genotype and swim behavior.

