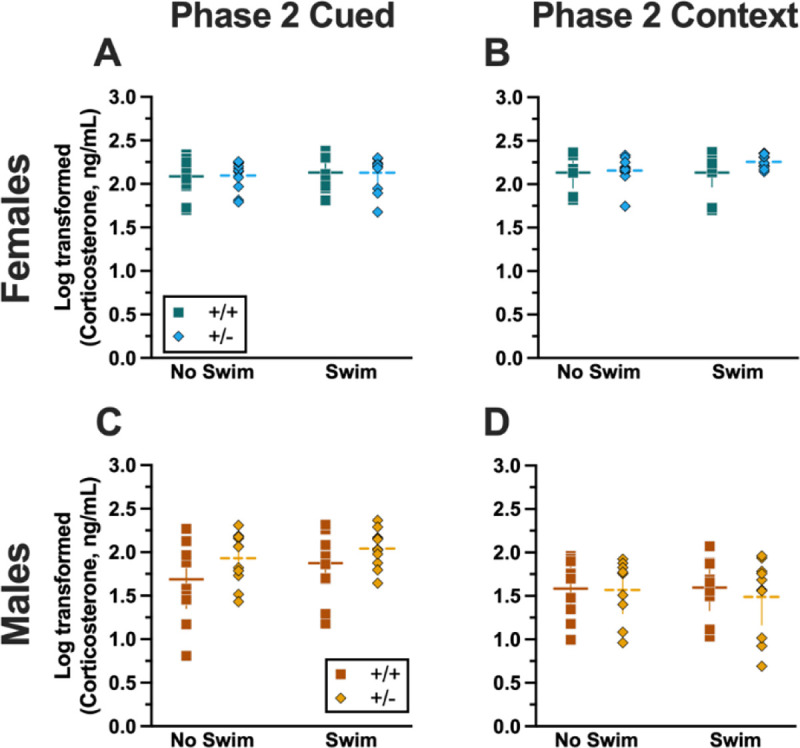
Figure 9.

Log-transformed corticosterone levels in mice from Phase 2. Mice in Phase 2 had blood collected 2 h following context fear testing and cued fear renewal to measure serum corticosterone levels. Female (A-B) wildtypes are represented by teal squares, and female heterozygotes are represented by blue diamonds. Male (C-D) wildtypes are represented by orange squares, and male heterozygotes are represented by yellow diamonds. Phase 2 cued data (A,C) and Phase 2 context data (B,D) are graphed in columns separated by sex. Data are log-transformed serum corticosterone levels, showing individual data points. Horizontal lines are shown as the mean, with vertical lines as ± 95% confidence interval.
