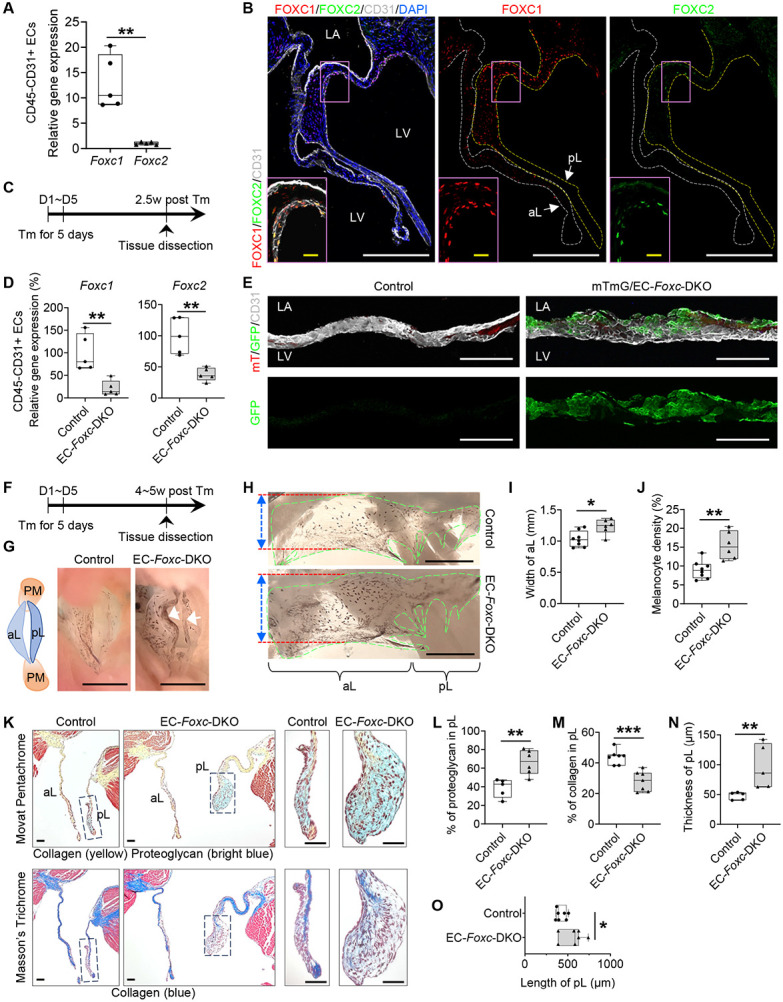
Figure 1. EC-specific deletion of Foxc1 and Foxc2 leads to myxomatous degeneration of mitral valves.

(A) Relative mRNA expression of Foxc1 and Foxc2 in isolated CD45−CD31+ endothelial cells (ECs) from Foxc1fl/fl;Foxc2fl/fl mouse heart. Data are box-and-whisker plots, Mann–Whitney U test, each symbol represents one mouse, N = 5, **P < 0.01.
(B) Representative fluorescent images of mitral valves (10 μm of cryo-section) from Foxc1fl/fl;Foxc2fl/fl mouse stained with CD31 (white), FOXC1 (red) and FOXC2 (green). White and yellow broken lines outline the anterior (aL) and posterior leaflets (pL) of the mitral valve (MV), respectively. In MV, FOXC1/FOXC2 expressing cells are not only ECs located on both sides (FOXC1) or fibrosa side (ventricle-facing side) (FOXC2) of the MV (especially pL), but also a few interstitial cells. LA: left atrium; LV: left ventricle. White/yellow scale bars = 200 or 20 μm, respectively.
(C) Schematic showing the time of tamoxifen (Tm) injection and tissue dissection for Figure 1, D-E.
(D) Relative mRNA expression of Foxc1 and Foxc2 in isolated CD45−CD31+ ECs from hearts post Tm dose in mice (Control: Foxc1fl/fl;Foxc2fl/fl, EC-Foxc-DKO: Cdh5-CreERT2;Foxc1fl/fl;Foxc2fl/fl). Data are box and whisker plots, Mann-Whitney U test, each symbol represents one mouse, N = 5, **P<0.01.
(E) Cre recombination efficiency detection in mTmG/EC-Foxc-DKO (mTmG/+;Cdh5-CreERT2;Foxc1fl/fl;Foxc2fl/fl) mice and littermate control mice (mTmG/+;Foxc1fl/fl;Foxc2fl/fl) by immunostaining of frozen heart sections with GFP and CD31. Representative confocal z-stacked images of these thick sections (16 μm) show GFP expression in ECs on MV. Scale bars = 100 μm.
(F) Schematic showing the time of tamoxifen (Tm) injection and tissue dissection for Figure 1, G-O, and Figure 2.
(G) Representative images of MVs taken from the perspective of the left ventricle. Arrows show the accumulation of melanocytes at the free edge of the leaflets in EC-Foxc-DKO mouse. The structural diagram in the left panel shows the structures seen in the right panels. PM: papillary muscle; aL: anterior leaflet; pL: posterior leaflet. Scale bar = 1 mm.
(H-J) Representative images (H) of flat-mount MVs (atrial aspect) under a stereo microscope. MVs are transparent membranes outlined by green broken lines. The darker background is cardiac muscles at the back of the MVs. The black dots or areas on the MVs are melanocytes. Red lines and double-sided arrows indicate the width of the anterior leaflet (aL) of the MV. pL: posterior leaflet. Scale bars = 1 mm. The width of aL and the density of melanocytes (%=area of melanocytes/area of MVs x 100%) were quantified in (I) and (J), respectively. Data are box-and-whisker plots, Mann–Whitney U test, each symbol represents one mouse, N = 6~8, *P < 0.05, **P < 0.01.
(K-O) Representative images (K) of Movat Pentachrome and Masson’s Trichrome stained MVs in serial sections show the ECM components including proteoglycan and collagen in MVs. Scale bars = 50 μm. The percentages of proteoglycan and collagen in posterior leaflets (pLs) were quantified in (L) and (M). The thicknesses (N) and lengths (O) of the pLs were also measured and quantified. Data are box-and-whisker plots, Mann–Whitney U test, each symbol represents one mouse, N = 5~7, *P < 0.05, **P < 0.01, ***P < 0.001.
