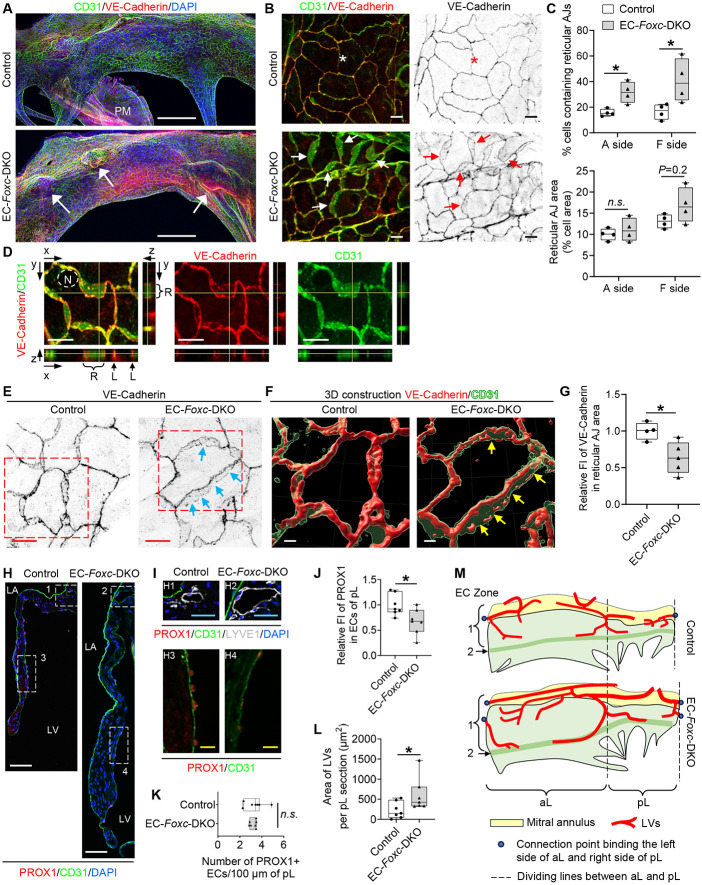
Figure 2. FOXC1 and FOXC2 maintain the integrity of endothelial cell junctions and lymphatic vessels in the mitral valves.
(A) Representative confocal images of the whole-mount posterior leaflets (pLs) of MVs stained with endothelial cell markers CD31 (green) and VE-Cadherin (red), as well as nuclear dye DAPI (blue). Images of maximum intensity projections of the atrial aspect of pLs show thickened pL with obvious protrusions (indicated by arrows) in EC-Foxc-DKO mice. Note that the locally increased VE-Cadherin staining in EC-Foxc-DKO pL is due to the images of thick pL being stacked. PM: papillary muscle. Scale bars = 200 μm.
(B) Magnified confocal images of whole-mount pLs stained with CD31/VE-Cadherin showing cell-cell junctions of ECs on the fibrosa side of pLs (in EC Zone 5 as shown in Supplemental Figure 1F). Stars indicate the linear junctions while arrows indicate the reticular adherens junctions (AJs) of ECs. Scale bars = 10 μm.
(C) Quantification of the reticular AJs on both atrial (A) and fibrosa (F) sides of the pLs based on the images as shown in Figure 2A. Data are box-and-whisker plots, Mann–Whitney U test, each symbol represents one mouse, N = 4, *P < 0.05, n.s., not significant.
(D)Orthogonal view of z-stacked images (0.3 um/step) showing the cell-cell junctions (stained with VE-Cadherin and CD31) of endocardial ECs in pL of EC-Foxc-DKO mouse. Yellow lines on the stack indicate the point in the stack that is being analyzed. R: reticular AJ area; L: linear cell-cell junction. N: nucleus of EC. Scale bars = 10 μm.
(E-G) Representative confocal images (E) of ECs containing reticular AJs stained with VE-Cadherin in pLs of MVs. The confocal images (boxed area) were further reconstructed to 3D isosurfaces by Imaris Workstation as shown in (F). Arrows in E and F indicate the discontinued cell-cell junctions in the reticular AJs. Scale bars = 10 μm in E and 4 μm in F. (G) Quantification of fluorescent intensity (FI) of VE-Cadherin in reticular AJs of ECs in pLs based on the images as shown in Figure 2E. Data are box-and-whisker plots, Mann–Whitney U test, each symbol represents one mouse, N = 4~5, *P < 0.05.
(H-L) Representative fluorescent images (H and I) of pLs of MVs. Box 1 and 2 in H and their magnified images (H1 and H2) in I show the lymphatic vessels located at the atrial side of the root of MVs, where the mitral annulus area is also positioned as shown in Figure S2A, stained by lymphatic endothelial cell (LEC) markers PROX1/CD31/LYVE1. Box 3 and 4 in H, as well as their magnified images (H3 and H4) in I, show the decreased expression of PROX1 in ECs at the fibrosa side of pL in EC-Foxc-DKO mouse. LA: left atrium, LV: left ventricle. White/blue/yellow scale bars = 50/25/10 μm, respectively. Quantification was performed based on the fluorescent images as shown in Figure 2H for: relative fluorescent intensity (FI) of PROX1 in ECs on the fibrosa side of pL (J) and the number of PROX1+ ECs (K), as well as the area of lymphatic vessels (LVs) in pL sections (L). Data are box-and-whisker plots, Mann–Whitney U test, each symbol represents one mouse, N = 7, *P < 0.05, n.s., not significant.
(M) Structural diagram (based on Figure S2D) shows the distribution of lymphatic vessels (LVs) in both anterior (aL) and posterior (pL) leaflets of MVs. In control mouse, LVs start from the blind-ended capillaries underneath the lower part of EC Zone 1. The lymphatic capillaries join at the dividing lines of aL and pL, then enter the mitral annulus to form collecting lymphatic vessels. The mitral annulus is also covered by EC zone 1 cells. In EC-Foxc-DKO mouse, most of the blind ends of LVs are underneath EC zone 2.

