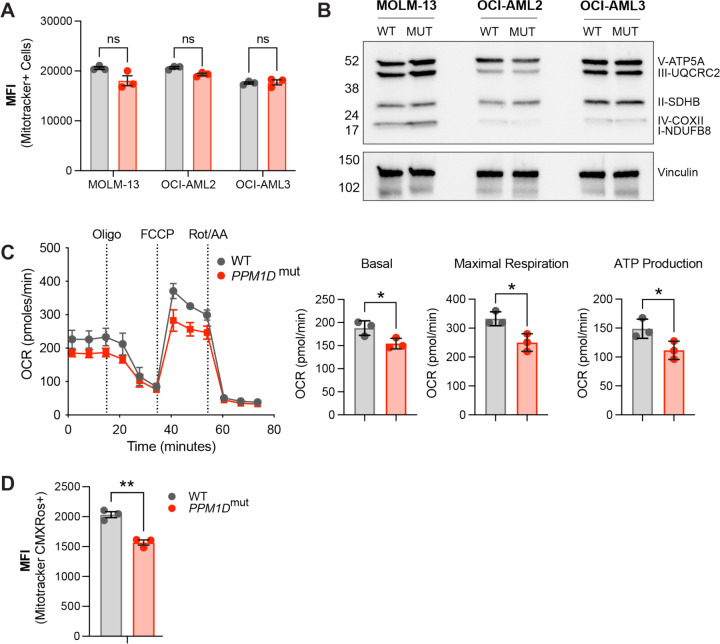
Figure 3. PPM1D-mutant cells have altered mitochondrial function.
(A) Mitochondrial mass of WT and PPM1D-mutant leukemia cells was determined using MitoTracker Green (100 nM) and the mean fluorescence intensity was analyzed by flow cytometry. Data represents mean ± SD of triplicates. At least three independent experiments were conducted with similar findings; unpaired t-tests. (B) Immunoblot of WT and PPM1D-mutant cell lysates probed with the human OXPHOS antibody cocktail (1:1000) and vinculin (1:2000). (C) Measurement of mitochondrial oxygen consumption rate (OCR) by seahorse assay in WT and PPM1D-mutant OCI-AML2 cells after treatment with oligomycin (1.5 uM), FCCP (0.5 uM), and rot/AA (0.5 uM). Quantification of basal, maximal, and ATP-linked respiration are shown. Data shown are the mean ± SD of technical triplicates. (D) Mitochondrial membrane potential of WT and PPM1D-mutant OCI-AML2 cells was measured using MitoTracker CMXRos (400 nM). The mean fluorescence intensity (MFI) was measured and analyzed by flow cytometry. Data represents mean ± SD of triplicates, unpaired t-test, ns=non-significant (p>0.05), *p<0.05, **p<0.01.

