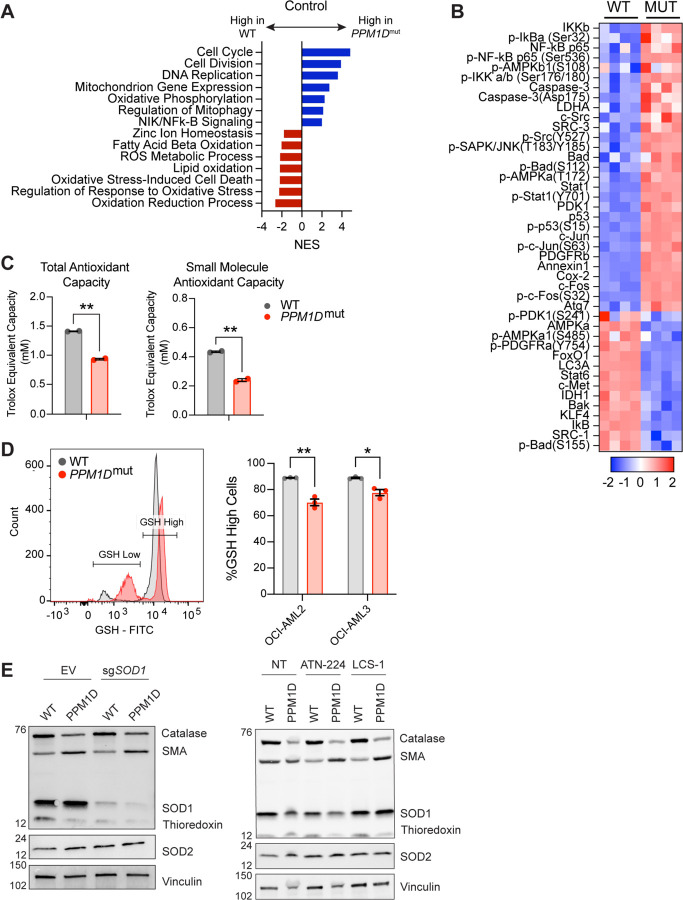
Figure 4. PPM1D-mutant cells have a reduced oxidative stress response.
(A) RNA-seq GSEA analysis of PPM1D-mutant cells compared to WT Cas9-OCI-AML2 cells. Significantly up- and downregulated pathways are indicated by the blue and red bars, respectively. Normalized enrichment scores (NES) are shown with FDR <0.25. (B) RPPA profiling of WT and PPM1D-mutant OCI-AML2 cells. Proteins from the “Response to Oxidative Stress” pathway have been selected for the heatmap. Each column represents a technical replicate. See Figure 4-source data 2 for the raw data. (C) Total- and small molecule antioxidant capacity of WT and PPM1D-mutant cells performed in technical duplicates. (D) Intracellular glutathione (GSH) levels measured by flow cytometry using the Intracellular GSH Detection kit (abcam). Left: representative flow cytometry plot demonstrating the gating for GSH-high and GSH-low populations. Right: quantification of the percentage of GSH-high cells for each cell line. Mean ± SEM (n=3) are shown. (E) Immunoblot of WT and PPM1D-mutant OCI-AML2 after transduction with the empty vector (EV) control and after SOD1 deletion (left) or after treatment with SOD1 inhibitors for 16 hours (right, ATN-224 12.5 uM, LCS-1 1.25 uM). Lysates were probed with an anti-oxidative stress defense cocktail (1:250), SOD2 (1:1000), and vinculin (1:2000). SMA=smooth muscle actin. Student t-tests were used for statistical analysis; **p<0.01, *p<0.05.

