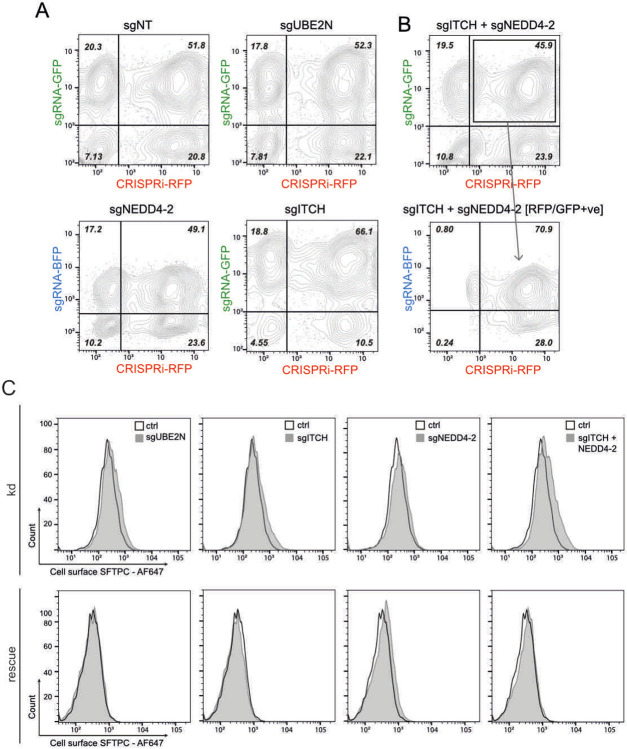
Extended Data Fig. 6. Flow cytometry gating strategy and cell-surface SFTPC measured during CRISPRi knockdown and recovery.
(A) Flow cytometry dot plots of sgRNA positive (y-axis) and CRISPRi-RFP (x-axis) positive populations in organoids transduced with sg non-targeting (NT), sgUBE2N, sgITCH, or sgNEDD4-2 at cell harvesting (5 days post induction of CRISPRi system). (B) (top panel) Flow cytometry dot plots of sgRNA positive (y-axis) and CRISPRi-RFP (x-axis) positive populations for cells transduced with both sgITCH and sgNEDD4-2 (5 days post induction of CRISPRi system). The population was first gated for GFP and RFP positive cells. The resulting population (outlined) was gated for BFP positive cells (bottom panel). (C) Flow cytometry of cell surface SFTPC as measured by C-terminal antibody (detecting full length protein) during knockdown (kd) and following rescue when compared with organoids expressing non-targeting control gRNAs.

