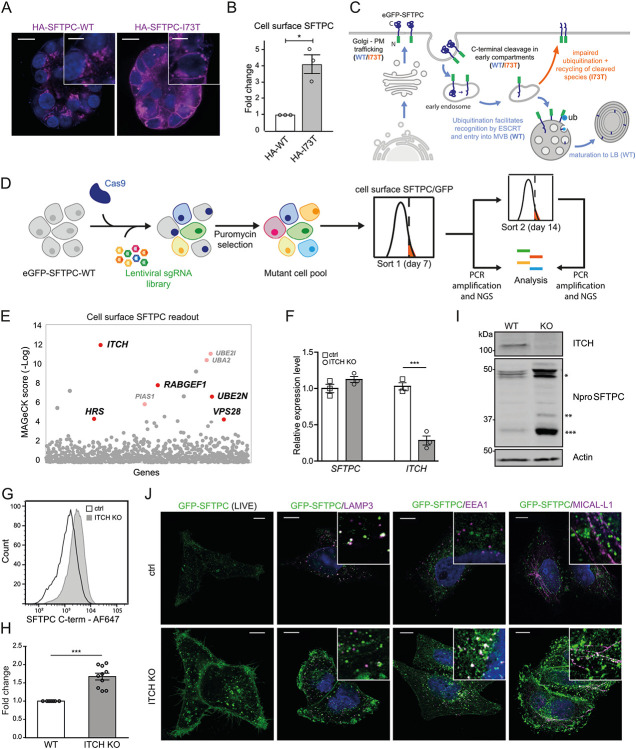
Fig. 3: A forward genetic screen confirms the importance of ubiquitination in SFTPC trafficking and identifies the E3 ligase ITCH as required for SFTPC maturation.
(A) Immunofluorescence of proSFTPC localisation in organoids expressing HA-SFTPC-WT or HA-SFTPC-I73T for 10 days. Scale bar 10 μm / 5 μm in zoomed inserts. (B) Quantification of cell surface SFTPC in organoids expressing HA-SFTPC-WT or HA-SFTPC-I73T as measured by SFTPC C-terminal antibody, expressed as fold change in mean fluorescence intensity; mean ± SEM, n=3 independent repeats (* = p<0.05, one-sample t-test). (C) Schematic of WT and pathogenic I73T variant SFTPC trafficking. After trafficking from early compartments to the plasma membrane, both WT and I73T are endocytosed and the C terminus cleaved in early endosomes. Onward trafficking into multivesicular bodies (MVBs) then lamellar bodies (LBs) is dependent upon further cleavage and ubiquitination; this fails in the I73T variant and results in recycling of partially cleaved isoforms to the plasma membrane. (D) Schematic of ubiquitome forward genetic screen strategy. HeLa cells stably expressing eGFP-SFTPC-WT and Cas9 were infected with a lentiviral ubiquitome sgRNA library consisting of 1,119 genes with 10 guides per gene. Transduced cells were selected with puromycin to generate a mutant cell pool. Day 7 post transduction, cells enriched for cell surface pro-SFTPC (as measured by a C-terminal antibody) or total GFP were isolated by FACS. These cells underwent a further enrichment sort at day 14. Genomic DNA was extracted from sorted cells and an unsorted control and genes with the highest gRNA representation identified by high-throughput sequencing. (E) MAGeCK score demonstrating relative enrichment of each gene for the day 7 cell surface SFTPC high population. (F) Relative expression of SFTPC and ITCH in control and ITCH knockout (KO) HeLa cells as measured by RT-qPCR and normalised to GAPDH; mean ± SEM, n=3 independent repeats (***=p<0.001, two-sided studen's t-test with non-equal variance). (G, H) Flow cytometry of cell surface SFTPC signal as measured by SFTPC C-terminal (C-term) antibody in control vs ITCH knockout lines and quantification of mean fluorescence intensity; mean ± SEM, n=10 independent repeats (*** = p<0.001, one-sample t-test). (I) Immunoblotting of lysates from control or ITCH knockout cells using an SFTPC N-terminal (Npro) and ITCH antibody (* = full length species (−/+ palmitoylation), ** = partially C-terminal cleaved intermediate, *** = fully C-terminally cleaved intermediate). (J) Live cell imaging and colocalisation of GFP-SFTPC with LAMP3, MICAL-L1 and EEA1 by immunofluorescence in control and ITCH knockout cells. Scale bar, 10 μm.

