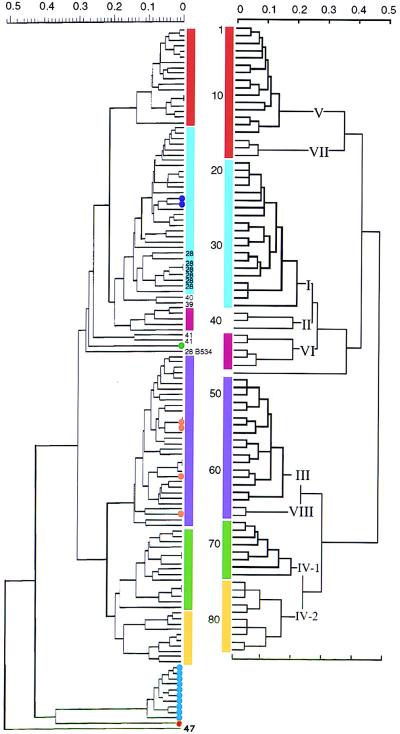
FIG. 2.
Comparison of the genetic relationships inferred by RAPD analysis (left) and MEE (right) (data for MEE are adapted from reference 14). The dendrograms resulting from cluster analysis show the genetic distance at which the clusters divided according to the unweighted pair group average clustering algorithm. In the dendrogram obtained by MEE, subgroups are indicated by Roman numerals and individual ETs are numbered 1 to 84 (top to bottom). Subgroups containing the same ETs in the dendrograms obtained by MEE and RAPD analysis are indicated by colored bars. Subgroup II is split into ET-39 and ET-40 isolates versus ET-41 isolates, as indicated by the numbers at the end of the branches. ET-28 isolate B534 is indicated by its strain number. Other ET-28 strains are labelled 28 at the ends of the branches. The recent Dutch isolates that have been tested are marked with dots: purple dots, ET-33 (strains 892411 and 902488); orange dots, ET-48 (strains 900973, 920054, and 921710) and strain 891780; green dot, new genotype within the serogroup A strains (strain 921051); blue dots, subtype P1.16 strains (strains 890461, 890592, 890867, 901335, 911652, 911960, 920521, 921268, 931114, and 931192); red dot, serotype 15 strain (strain 892665) related to the serogroup B ET-5 complex (see text).

