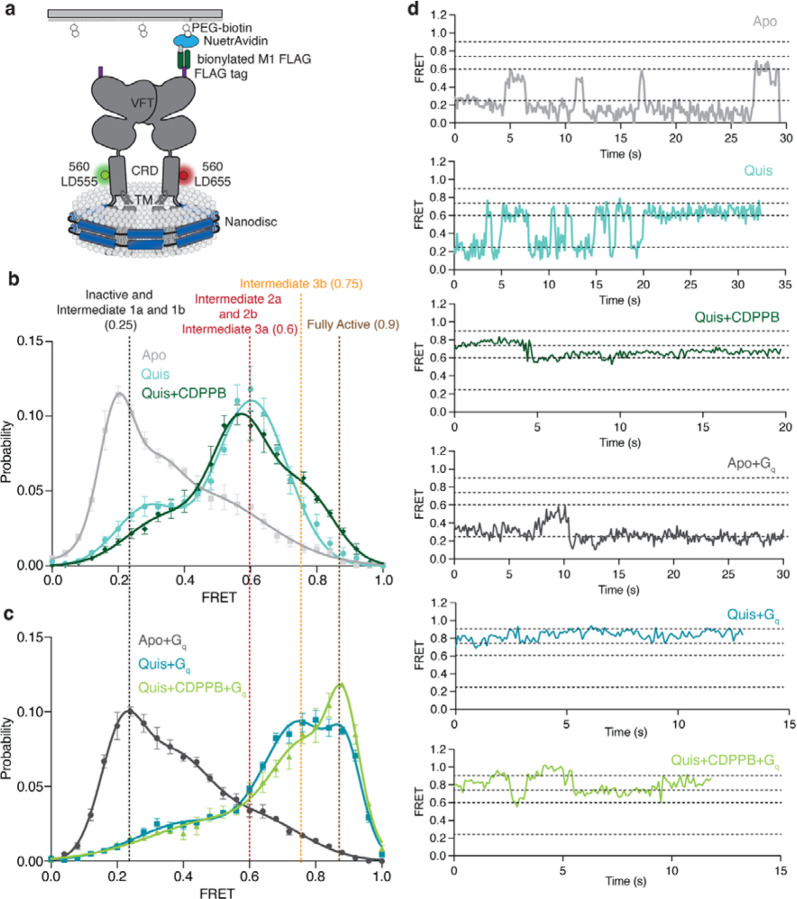
Fig 4: Ligand stabilised conformations of mGlu5 in nanodisc.
a) A schematic representation of the smFRET experiment.
b) In the Apo state (grey) a dominant inactive FRET peak at ~ 0.25 is observed ( N=319). The binding of the agonist, Quis results in the appearance of a ~ 0.6 FRET state (Intermediate 2a, cyan, N=392) with a minor peak at ~ 0.25 (Intermediate 1a). The addition of CDPPB to Quis-bound mGlu5 stabilizes the ~ 0.6 FRET state (Intermediate 3a), decreases the occupancy of the ~ 0.25 state, and results in the appearance of a new FRET peak at ~ 0.75 (Intermediate 3b, dark green, N=329). High FRET (~ 0.6 and ~ 0.75) represents the active state population of the receptor with the CRDs and TMs in close proximity. Histograms are shown with a 3-Gaussian fit to the data and represented as mean ± SEM.
c) The coupling of Gq to Apo (dark grey, N=329) remains largely unchanged compared to Apo alone (Figure 4b), while the addition of Gq in the presence of Quis results in the near complete abrogation of the ~ 0.6 FRET peak in favor of the ~ 0.75 peak (Intermediate 3b) and a new peak at ~ 0.9 (Fully Active) (teal, N=306), which is further stabilized in the presence of CDPPB (light green, N=317). Histograms are shown with a 3-Gaussian fit to the data and represented as mean ± SEM.
d) Example FRET traces are shown for each ligand condition.

