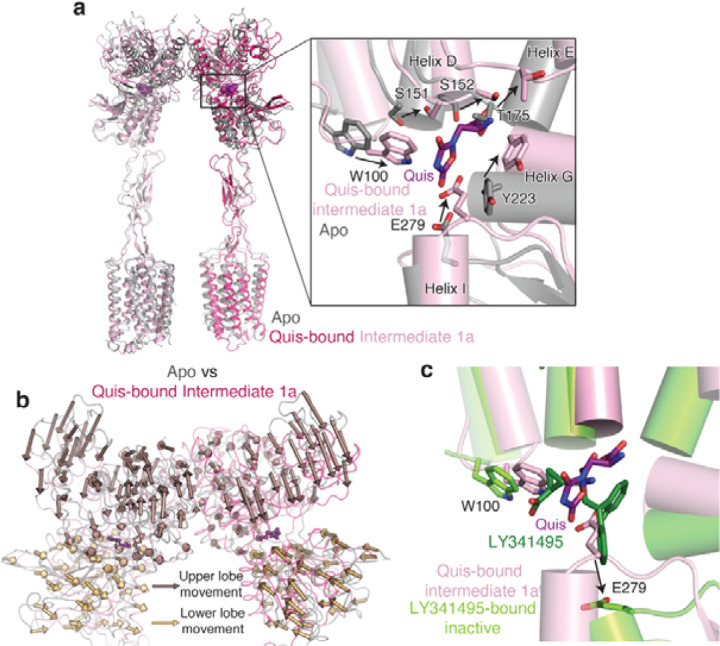
Extended Data Figure 3: Comparison of Apo and Quis-bound Intermediate 1a structures.
(a) Overlay of the Apo (grey, PDB: 6N52) and Quis-bound Intermediate 1a showing CRDs and TMs in an “inactive” state. Insert shows the Quis binding pocket.
(b) Movement of the VFTs upon agonist binding in Quis-bound Intermediate 1a state compared to the Apo state (PDB 6N52, grey). Arrows represent the movement of every 5 Cα atoms from the Apo to the Intermediate 1a state upon Quis binding. Nb43 is shown in yellow.
(c) To get insights into structural changes needed to initiate activation, we compared the Quis-bound Intermediate 1a (light pink) and the antagonist, LY341495-bound (PDB: 7FD9, dark green) mGlu5 structures. LY341495 binding to the receptor inhibits the movement of residues W100 and E279.

