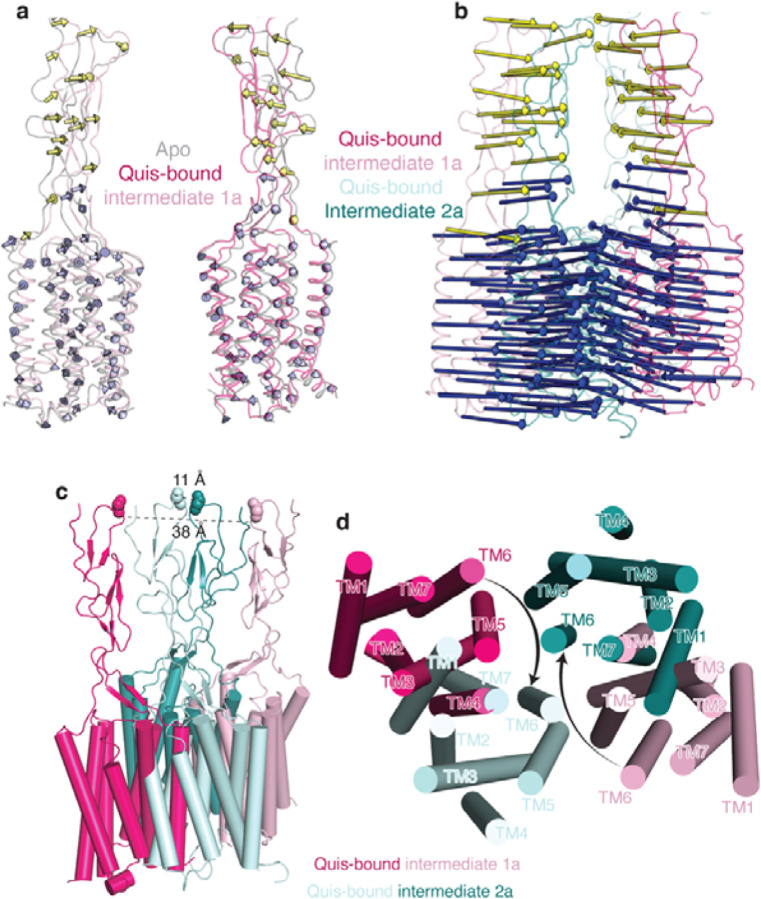
Extended Data Figure 5: mGlu5 transmembrane changes upon activation.
a) Overlay of Apo (grey, PDB: 6N52) and Quis-bound Intermediate 1a states show minimal changes in the CRDs and TMs. Arrows represent the movement of every 5 Cα atoms from Apo to Intermediate 1a.
b) Large changes in the CRDs and TMs are seen when comparing the Quis-bound Intermediate 1a and the Quis-bound Intermediate 2a states. Arrows represent the movement of every 5 Cα atoms from Intermediate 1a state to Intermediate 2a.
c) The CRDs in the Quis-bound Intermediate 1a structure are separated by ~ 38 Å (as measured at residue E527). In the Quis-bound Intermediate 2a state, the twisting of the lower lobe enables the CRDs (~ 11 Å at residue E527) and TMs to move adjacent to each other.
d) The TMs in the Quis-bound Intermediate 1a structure are far apart with TM5 being the most proximal helix pair (~ 21 Å). In the Quis-bound Intermediate 2a state the TMs of the protomers, in addition to moving closer to each other, rotate ~ 20° to form a TM6-TM6 interface, a hallmark of Family C activation.

