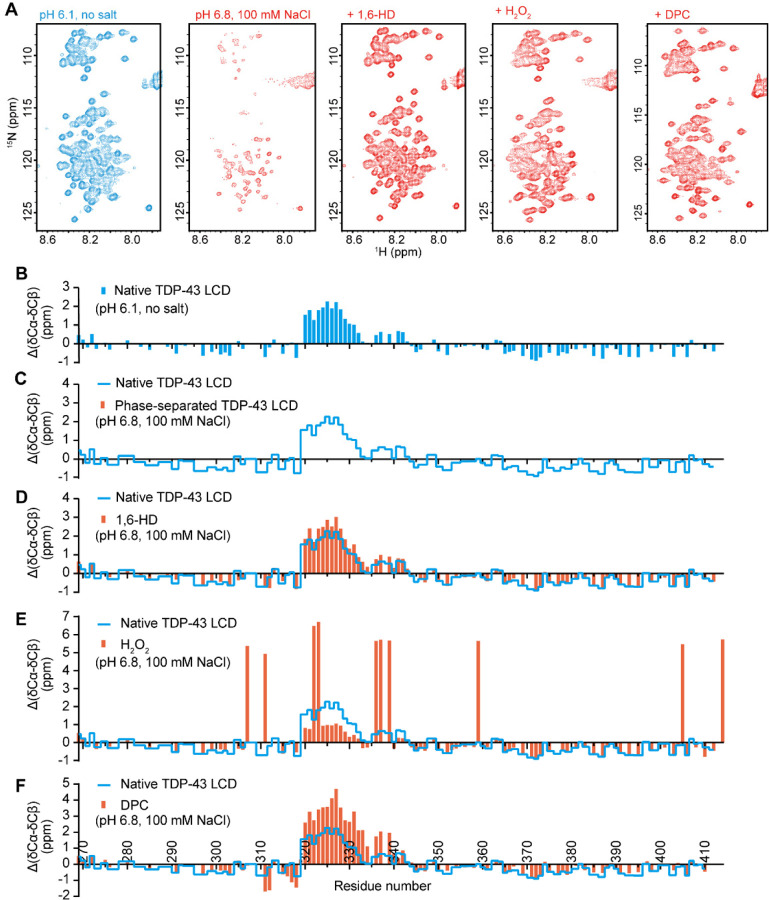
Fig. 3. Solution NMR spectroscopic measurements of the TDP-43 low complexity domain under conditions that either allow or impede phase separation.
(A) 1H-15N HSQC spectra of TDP-43 low complexity domain (LCD) under indicated conditions. Under conditions of acidic pH (6.1) and absence of salt ions, the TDP-43 LCD fails to undergo phase separation, thus allowing secondary structure analysis by solution NMR. Under conditions of pH 6.8 in the presence of 100 mM NaCl, the TDP-43 LCD undergoes phase separation, thus impeding NMR structural measurement, as indicated by the weak or absent 1H-15N HSQC cross-peaks. Upon exposure to 10% 1,6-HD, after H2O2-mediated methionine oxidation, or upon exposure to 80mM DPC, HSQC signals were restored, allowing NMR structural analysis. (B-F) ∆(δCα-δCβ) conformational shifts with respect to random coil of TDP-43 under different conditions: (B) Acidic pH in the absence of monovalent salt ions. Under such conditions the protein is unable to self-associate, thus allowing backbone resonance assignments with triple resonance experiments. The region between residues 320 and 339 is observed to adopt partially α-helical conformation as reported previously (11–13). (C) Backbone 13C chemical shifts cannot be obtained for phase separated protein as assayed in buffer conditions of neutral pH and physiologic levels of monovalent salt ions because triple resonance experiments are obscured by aggregation. (D) Protein at neutral pH and physiological levels of monovalent salt ions, yet exposed to 10% 1,6-HD. Evidence of α-helical secondary structure is observed between residues 320 and 339. (E) Protein at neutral pH and physiological levels of monovalent salt ions, yet exposed to 1% hydrogen peroxide (Materials and Methods). The large positive values of ∆(δCα-δCβ) arise because of oxidation of the ten methionine residues. Evidence of partial α-helical secondary structure is observed for the protein region between residues 320 and 330. (F) Protein at neutral pH and physiological levels of monovalent salt ions, yet exposed to 80mM the DPC lipid-mimic detergent (Materials and Methods). Evidence of increased α-helical secondary structure is observed between residues 320 and 339. For Panels C-F, blue lines correspond to a trace of the secondary shifts shown in Panel B.

