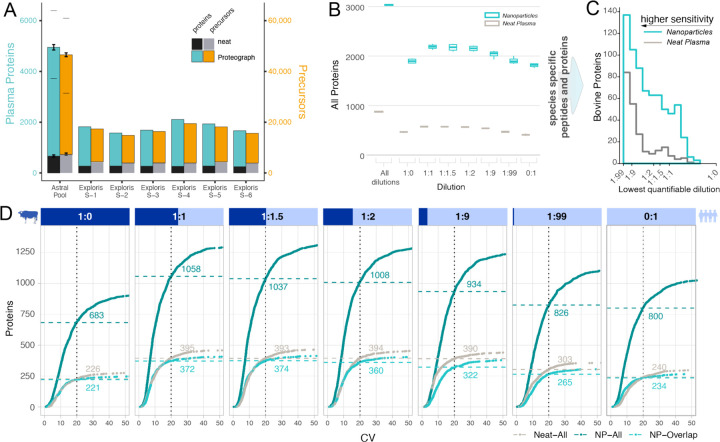
Figure 3. Identification and Precision Performance of a Neat Plasma and NP-corona Workflow.
(A) Protein (left y-axis) and precursor identifications (right y-axis) determined for different LC-MS setups and biosamples comparing traditional neat workflows and NP workflow. Thermo Scientific Orbitrap Astral MS data was acquired for assay replicates standard deviations indicated by error bars, lower dash denoting identifications shared by all replicates (N=3), upper dash indicates identification across all replicates and nanoparticles. (B) The number of proteins quantified in mixed species plasma experiment on Exploris 480 at each ratio for the NP (teal) and neat workflow (grey), including bovine proteins and human proteins and those that are shared between species. Subsequent plots focused on species specific (unique) peptides and proteins. (C) Lower limits of quantification (LoQ) for bovine proteins quantified in both workflows. LoQ is the lowest level of dilution with a stringent quantitative response (lower is better). (D Number of proteins identified at a given coefficient of variation (CV) threshold for each spiked-in ratio. X-axis is the CV, and the Y-axis is the total number of bovine and human proteins quantified in four replicates with a CV lower than the given threshold. NP-workflow proteins also identified in neat (light teal), NP-workflow with all proteins (dark teal), and neat workflow (grey). Data shown is for IP10 human plasma pool.

