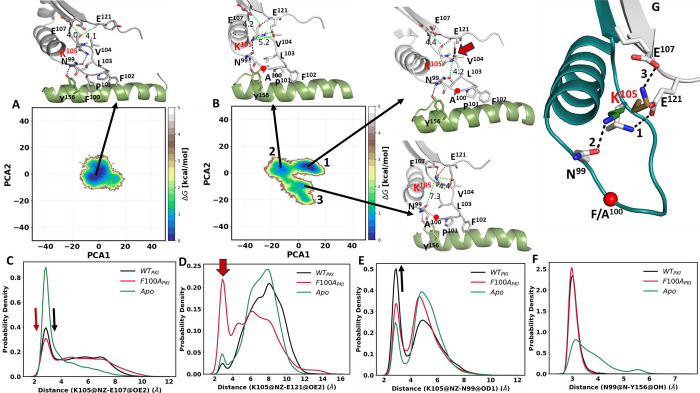
Figure 11. Energy landscapes of wt C-subunit and F100A mutant in ternary complex.
The free energy landscapes (FEL) were generated based on the principal component analysis (PCA) for the wt C-subunit with PKI (A) and F100A mutant with PKI (B). The H-bonds are shown in the black dash line and the non H-bond in green along with the distance in Angstroms (Å). The probability distribution plots for specific side chain dynamics are also shown; (C) K105 NZ to E107 OE2, (D) K105 NZ to E121OE2, (E) K105 NZ to N99 OD1, and (F). N99 N to Y156 OH. (G) the enhanced side chain dynamics of K105 in the F100A ternary complex: the side chain of K105 toggles to its neighboring residues, E121 (white, global energy minima), N99 (green, first secondary minima), and E107 (sand, second secondary minima). The probability density function (PDF) is a relative measure of how densely data points are distributed along the x-axis.

