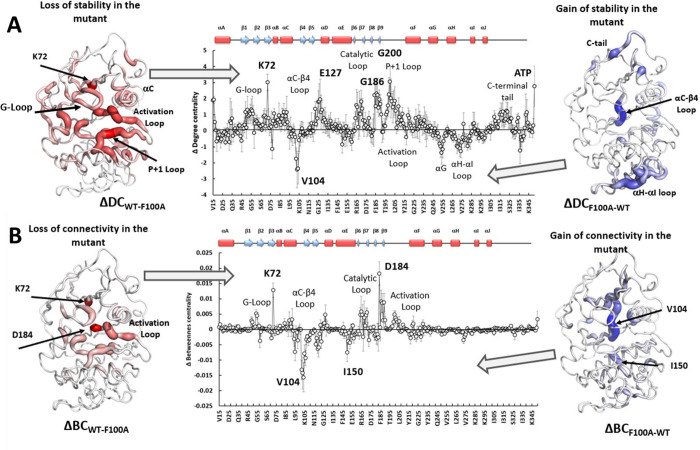
Figure 8. Changes of DC and BC in PKA upon F100A mutation.
The middle graphs represent changes in the corresponding parameters. Positive changes are mapped on the PKA structure (left) with dark red color corresponding to the maximum changes. On the right the negative values of the changes are mapped on the structure to illustrate their distribution. Dark blue color corresponds to the most negative values. Error bars represent standard error calculated for five 10 ns trajectories. The secondary structure of PKA is shown on top of the sequence axis for reference.

