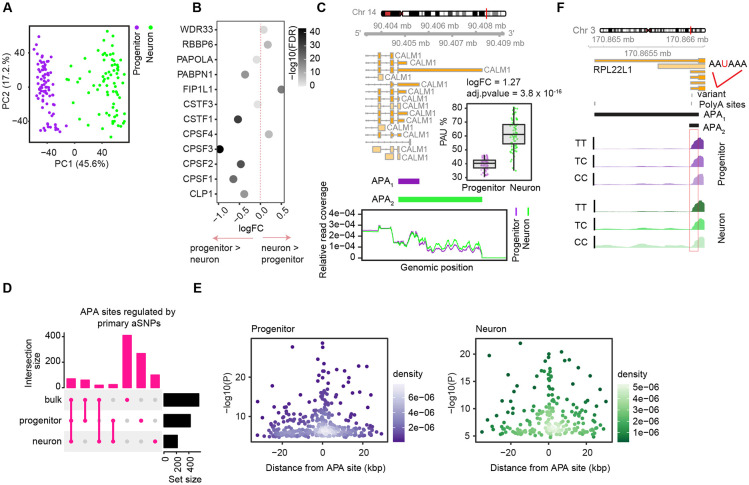
Figure 4. Cell-type-specific alternative polyadenylation and apaQTLs.
(A) Principal component analysis for alternative polyadenylation (APA) site usage colored by cell-type.
(B) Differentially expressed genes between progenitors and neurons that encode proteins playing a role in alternative polyadenylation. Fold change (logFC) is given on the x-axis and data points are colored by adjusted p-value at −log10 scale. logFC > 0 indicates the genes upregulated in neurons and logFC < 0 indicates the genes upregulated in progenitors, and logFC = 0 is shown with dashed vertical line line.
(C) Two APA sites of CALM1 which were differentially expressed between progenitors and neurons are shown. Gene model for CALM1 is provided above, and relative read count per APA sites for each cell-type are shown where relative read coverage calculated as ratio of number of count supporting each APA site to total number of reads including both APA sites are shown on the y-axis; and genomic position of the reads are shown on the x-axis. Differential expression of APA2 (longer 3’UTR isoform) is shown between cell-types.
(D) Overlap of APA sites regulated by primary aSNPs across progenitors, neurons and fetal bulk brain data.
(E) Primary apaQTLs were more significantly associated with APA as they were closer to APA sites. Association p-values at −log10 scale are shown on the y-axis and distance from APA sites are shown on the x-axis for progenitors (left) and neurons (right), density of the data points are indicated by color density per cell-type.
(F) apaQTL overlapping with canonical polyadenylation signal motif AAUAAA for gene RPL221 is shown for each cell type. Read coverage per genotype is shown.

